Welcome to the Reference Manual of Hazelcast IMDG Management Center. This manual includes concepts and instructions to guide you on how to use Management Center to monitor your Hazelcast IMDG Cluster.
Preface
Hazelcast Management Center enables you to monitor and manage your cluster members running Hazelcast IMDG. In addition to monitoring the overall state of your clusters, you can also analyze and browse your data structures in detail, update map configurations and take thread dumps from the members. You can run scripts (JavaScript, Groovy, etc.) and commands on your members with its scripting and console modules.
Naming
-
Hazelcast Management Center or Management Center refers to the Hazelcast IMDG cluster monitoring tool provided by Hazelcast, Inc.
-
Hazelcast IMDG or just Hazelcast refers to the Hazelcast in-memory data grid middleware. Hazelcast is also the name of the company (Hazelcast, Inc.) providing Hazelcast IMDG.
Hazelcast IMDG
Hazelcast Management Center is delivered with Hazelcast IMDG. It can also be downloaded as a separate package from the hazelcast.org website.
See the Hazelcast IMDG Reference Manual for all Hazelcast IMDG topics including the clusters and their operations, clients, data structures, computing and WAN replication.
Licensing
This Reference Manual is free and provided under the Apache License, Version 2.0.
Hazelcast Management Center requires either a Management Center license or Hazelcast IMDG Enterprise license or Hazelcast IMDG Enterprise HD license. It also has a free version which lets you to monitor your cluster having up to three IMDG members.
Trademarks
Hazelcast is a registered trademark of Hazelcast, Inc. All other trademarks in this manual are held by their respective owners.
Getting Help
Support is provided via the following channels:
-
Stack Overflow (ask a question on how to use Management Center properly and troubleshoot your setup)
-
Hazelcast mailing list (propose features and discuss your ideas with the team)
Release Notes
See the Release Notes document for the new features, enhancements and fixes performed for each Hazelcast Management Center release.
1. Browser Compatibility
The Hazelcast Management Center is tested and works on the following browsers:
-
Chrome 65 and newer
-
Firefox 57 and newer
-
Safari 11 and newer
-
Internet Explorer 11 and newer
2. Getting Started
To start using the Management Center:
-
download the Hazelcast IMDG or Management Center package
-
start the Management Center service
-
launch the Management Center user interface.
2.1. Downloading Management Center
Hazelcast Management Center is included in the Hazelcast IMDG download package. You can download it from the download page of Hazelcast’s website.
When a new Hazelcast IMDG version is released, it comes with the Management Center having the same version with IMDG. There may be times when a new Management Center version is released before a new version of Hazelcast IMDG. In that case, you may download the new Management Center from its download page as a separate package. Note that, the Management Center is compatible with Hazelcast IMDG cluster members having the same or the previous minor version. For example, Hazelcast Management Center version 3.12.x works with Hazelcast IMDG cluster members having version 3.11.x or 3.12.x.
2.2. Starting the Management Center Service
You have two options to start the Management Center service:
-
deploying the file
hazelcast-mancenter-3.12.15.waron your Java application server/container -
starting Hazelcast Management Center from the command line
-
using the scripts that come with the download package.
| Starting with version 3.10, you need Java Runtime Environment 1.8 or later to run Hazelcast Management Center. |
2.2.1. Using the Command Line
After you downloaded, extract the Hazelcast IMDG or Management Center package.
The extracted directory, i.e., hazelcast-management-center-3.12.15,
contains the hazelcast-mancenter-3.12.15.war file.
You can start this file directly from the command line using the following command:
java -jar hazelcast-mancenter-3.12.15.war 8080 hazelcast-mancenterThe above command starts the Hazelcast Management Center service on
the port 8080 with the hazelcast-mancenter context
path (http://localhost:8080/hazelcast-mancenter). Note that,
the Hazelcast IMDG cluster members should know the
URL of the hazelcast-mancenter application before they start.
See the Connecting IMDG Members to Management Center chapter.
For the options you can provide when starting with the command line, see the Configuring Management Center chapter. In that chapter, you can learn about topics including how to start with a license or extra classpath, how to configure the security, disk usage, update interval or logging.
2.2.2. Deploying to Application Server
Instead of starting at the command line, you can deploy the Management Center to your application server (Tomcat, Jetty, etc.).
If you have deployed hazelcast-mancenter-3.12.15.war in your already-SSL-enabled web
container, configure hazelcast.xml as follows, before starting
a Hazelcast IMDG cluster member:
<management-center enabled="true">
    https://localhost:sslPortNumber/hazelcast-mancenter
</management-center>
If you are using an untrusted certificate for your container, which you created yourself, you need to add that certificate to your JVM first. Download the certificate from the browser and add it to the JVM as follows:
keytool -import -noprompt -trustcacerts -alias <AliasName> -file <certificateFile> -keystore $JAVA_HOME/jre/lib/security/cacerts -storepass <Password>2.2.3. Using Scripts in the Package
As another option, you can use the start.bat or start.sh scripts,
which come with the download package, to start the Management Center.
You can find these scripts under the extracted directory.
3. Configuring Management Center
This chapter explains how you can configure the Management Center according to your needs.
3.1. Providing a License
When starting the Management Center from the command line, a
license can be provided using the system property hazelcast.mc.license.
For example by using the command line parameter:
java -Dhazelcast.mc.license=<key> -jar hazelcast-mancenter-3.12.15.warWhen this option is used, the license provided takes precedence
over any license set and stored previously using the user interface.
Previously stored licenses are not affected and will be used again
when the Management Center is started without the hazelcast.mc.license property.
This also means no new license can be stored when the property is used.
3.2. Providing an Extra Classpath
You can also start the Management Center with an extra classpath entry (for example, when using JAAS authentication) by using the following command:
java -cp "hazelcast-mancenter-3.12.15.war:/path/to/an/extra.jar" Launcher 8080 hazelcast-mancenterOn Windows, the command becomes as follows (semicolon instead of colon):
java -cp "hazelcast-mancenter-3.12.15.war;/path/to/an/extra.jar" Launcher 8080 hazelcast-mancenter3.3. Configuring Update Interval
You can set a frequency (in seconds) for which the Management Center
retrieves information from the Hazelcast IMDG cluster, using the
update-interval attribute as shown below:
<management-center enabled="true" update-interval="3">
   http://localhost:8080/hazelcast-mancenter
</management-center>
Using this attribute is optional and its default value is 3 seconds.
3.4. Configuring Disk Usage
The disk space used by the Management Center is constrained to avoid exceeding available disk space. When the set limit is exceeded, the Management Center deals with this in the following ways:
-
Persisted statistics data is removed, starting with the oldest (one month at a time).
-
Persisted alerts are removed for filters that report further alerts.
Usually, either of the above automatically resolves the situation and makes room for new data. Depending on the disk usage configuration and the kind of data that contributes to exceeding the limit it can occur that the limit continues to be exceeded. In this case, the Management Center does not store new alerts or metrics data. Other data (like configurations and account information) is still stored as they hardly cause larger data volumes.
An active blockage is reported in the UI as an error notification, as shown below:

However, storage operations do not explicitly fail or report errors since this would constantly cause interruptions and error logging both in the UI and logs.
One way to resolve a blockage is deleting the data manually, e.g., deleting a
filter that caused many alerts in the alerts view.
Another way is to restart the Management Center with a higher limit or
in the purge mode (if not used before).
You can use the following system properties to configure the Management Center’s disk usage control:
-
-Dhazelcast.mc.disk.usage.mode: Available values arepurgeandblock. If the mode ispurge, persisted statistics data is removed (as stated in the beginning of this section). If it isblock, persisted statistics data is not removed. Its default value ispurge. -
-Dhazelcast.mc.disk.usage.limit: The high water mark inKB,MBorGB. Its default value adapts to the available disk space and the space already used by database files. At a maximum it will default to512MBunless existing data already exceeds this maximum. In that case the already used space is used as limit. The minimal allowed limit is2MB. -
-Dhazelcast.mc.disk.usage.interval: Specifies how often the disk usage is checked to see if it exceeds the limit (hazelcast.mc.disk.usage.limit). It is in milliseconds and its default value is1000milliseconds. Set values have to be in range of50to5000ms.
It is important to understand that the limit given is a soft limit, a high water mark. The Management Center will act if it is exceeded but it might be exceeded by a margin between two measurements. Do not set it to the absolute maximum disk space available. A smaller interval increases accuracy but also performance overhead.
In case of a misconfiguration of any of the above three properties, the Management Center logs the problem and aborts startup immediately.
3.5. Enabling Health Check Endpoint
When running the Management Center from the command line, you can enable
the Health Check endpoint. This endpoint responds with 200 OK HTTP
status code once the Management Center web application has started. The
endpoint is available on port <Management Center HTTP port> + 1 with
context path <Management Center context path>/health (by default, its
URL is http://localhost:8081/hazelcast-mancenter/health). Note that the
HTTP protocol is always used for the Health Check endpoint, independently
of TLS/SSL settings, and no additional authentication is enforced for it.
If you want to enable the Health Check endpoint, use the following command line argument:
-Dhazelcast.mc.healthCheck.enable=true3.6. Configuring Sessions
This section provides information on how to configure the Management Center sessions for various aspects including timeouts and login/logout operations.
3.6.1. Configuring Session Timeout
If you have started the Management Center from the command line
by using the WAR file, by default, the sessions that are inactive for
30 minutes are invalidated. To change this, you can use the
-Dhazelcast.mc.session.timeout.seconds command line parameter.
For example, the following command starts the Management Center with a session timeout period of 1 minute:
java -Dhazelcast.mc.session.timeout.seconds=60 -jar hazelcast-mancenter-3.12.15.warIf you have deployed the Management Center on an application server/container, you can configure the default session timeout period of the application server/container to change the session timeout period for the Management Center. If your server/container allows application specific configuration, you can use it to configure the session timeout period for the Management Center.
3.6.2. Enabling Multiple Simultaneous Login Attempts
Normally, a user account on the Management Center can’t be used from
multiple locations at the same time. If you want to allow
others to log in, when there’s already someone logged in with the
same username, you can start the Management Center with
the -Dhazelcast.mc.allowMultipleLogin=true command line parameter.
3.6.3. Disable Login Configuration
In order to prevent password guessing attacks, logging in is disabled temporarily after a number of failed login attempts. When not configured explicitly, the default values are used, i.e., logging in is disabled for 5 seconds when a username is failed to log in consecutively 3 times. During this 5 seconds of period, logging in is not allowed even when the correct credentials are used. After 5 seconds, the user will be able to log in using the correct credentials.
Assuming the configuration with the default values, if the failed
attempts continue (consecutively 3 times) after the period of disabled
login passes, this time the disable period is multiplied by 10:
logging in is disabled for 50 seconds. The whole process repeats
itself until the user logs in successfully. By default, there’s no upper
limit to the disable period, but can be configured by using the
-Dhazelcast.mc.maxDisableLoginPeriod parameter.
Here is a scenario, in the given order, with the default values:
-
You try to login with your credentials consecutively 3 times but failed.
-
Logging in is disabled and you have to wait for 5 seconds.
-
After 5 seconds have passed, logging in is enabled.
-
You try to login with your credentials consecutively 3 times but again failed.
-
Logging in is disabled again and this time you have to wait for 50 seconds until your next login attempt.
-
And so on; each 3 consecutive login failures causes the disable period to be multiplied by 10.
You can configure the number of failed login attempts, initial and maximum duration of the disabled login and the multiplier using the following command line parameters:
-
-Dhazelcast.mc.failedAttemptsBeforeDisableLogin: Number of failed login attempts that cause the logging in to be disabled temporarily. Default value is3. -
-Dhazelcast.mc.initialDisableLoginPeriod: Initial duration for the disabled login in seconds. Default value is5. -
-Dhazelcast.mc.disableLoginPeriodMultiplier: Multiplier used for extending the disable period in case the failed login attempts continue after disable period passes. Default value is10. -
-Dhazelcast.mc.maxDisableLoginPeriod: Maximum amount of time for the disable login period. This parameter does not have a default value. By default, disabled login period is not limited.
3.6.4. Forcing Logout on Multiple Simultaneous Login Attempts
If you haven’t allowed multiple simultaneous login attempts explicitly,
the first user to login with a username stays
logged in until that username explicitly logs out or its session expires.
In the meantime, no one else can login with the same
username. If you want to force logout for the first user and let the
newcomer login, you need to start Management
Center with the -Dhazelcast.mc.forceLogoutOnMultipleLogin=true command
line parameter.
3.7. Configuring and Enabling Security
This section provides information on how to use and manage the Management Center with TLS/SSL and mutual authentication. You will also learn how to force the users to specify passwords that are hard to guess.
3.7.1. Using Management Center with TLS/SSL Only
To encrypt data transmitted over all channels of the Management Center using TLS/SSL, make sure you do all of the following:
-
Deploy the Management Center on a TLS/SSL enabled container or start it from the command line with TLS/SSL enabled. See Installing the Management Center.
-
Another option is to place the Management Center behind a TLS-enabled reverse proxy. In that case, make sure your reverse proxy sets the necessary HTTP header (
X-Forwarded-Proto) for resolving the correct protocol.
-
-
Enable TLS/SSL communication to the Management Center for your Hazelcast cluster. See Connecting Hazelcast members to the Management Center.
-
If you’re using Clustered JMX on the Management center, enable TLS/SSL for it. See Enabling TLS/SSL for Clustered JMX.
-
If you’re using LDAP authentication, make sure you use LDAPS or enable the "Start TLS" field. See LDAP Authentication.
-
If you’re using Active Directory authentication, make sure you use Java’s truststore related system properties. See Active Directory Authentication.
You can configure how Management Center treats X-Forwarded-*
headers using the system property hazelcast.mc.forwarded.requests.enabled.
If its value is set to true, Management Center accepts and treats them
as set by a reverse proxy in front of it, otherwise, they are ignored.
Its default value is true.
|
3.7.2. Enabling TLS/SSL When Starting with WAR File
When you start the Management Center from the command line, it serves the pages unencrypted by using "http", by default. To enable TLS/SSL, use the following command line parameters when starting the Management Center:
-
-Dhazelcast.mc.tls.enabled: Specifies whether TLS/SSL is enabled. Its default value is false (disabled). -
-Dhazelcast.mc.tls.keyStore: Path to the keystore. -
-Dhazelcast.mc.tls.keyStorePassword: Password of the keystore. -
-Dhazelcast.mc.tls.trustStore: Path to the truststore. -
-Dhazelcast.mc.tls.trustStorePassword: Password of the truststore.
You can leave the truststore and truststore password values empty to use the system JVM’s own truststore.
The following is an example on how to start the Management Center with TLS/SSL enabled from the command line:
java -Dhazelcast.mc.tls.enabled=true
-Dhazelcast.mc.tls.keyStore=/some/dir/selfsigned.jks
-Dhazelcast.mc.tls.keyStorePassword=yourpassword -jar hazelcast-mancenter-3.12.15.war
You can access the Management Center from the following HTTPS URL on
port 8443: https://localhost:8443/hazelcast-mancenter.
On the member side, you need to configure the Management Center URL
as https://localhost:8443/hazelcast-mancenter and also set the
following JVM arguments when starting the member:
-Djavax.net.ssl.trustStore=path to your truststore
-Djavax.net.ssl.trustStorePassword=yourpassword| If you plan to use a self-signed certificate, make sure to create a certificate with the hostname of the machine you will deploy the Management Center on. Otherwise, you will see a line similar to the following in the member logs: |
javax.net.ssl.SSLHandshakeException: java.security.cert.CertificateException:
No subject alternative names matching IP address 127.0.0.1 found
To override the HTTPS port, you can give it as the second argument when starting the Management Center. For example:
java -Dhazelcast.mc.tls.enabled=true
-Dhazelcast.mc.tls.keyStore=/dir/to/certificate.jks
-Dhazelcast.mc.tls.keyStorePassword=yourpassword -jar hazelcast-mancenter-3.12.15.war 80 443 hazelcast-mancenter
This starts the Management Center on HTTPS port 443 with context path /hazelcast-mancenter.
| You can encrypt the keystore/truststore passwords and pass them as command line arguments in encrypted form for improved security. See the Variable Replacers section for more information. |
Enabling HTTP Port
By default, HTTP port is disabled when you enable TLS. If you want to have an open HTTP port that redirects to the HTTPS port, use the following command line argument:
-Dhazelcast.mc.tls.enableHttpPort=trueManaging TLS Enabled Clusters
If a Hazelcast cluster is configured to use TLS for communication between its members using a self-signed certificate, the Management Center will not be able to perform some of the operations that use the cluster’s HTTP endpoints (such as shutting down a member or getting the thread dump of a member). This is so because self-signed certificates are not trusted by default by the JVM. For these operations to work, you need to configure a truststore containing the public key of the self-signed certificate when starting the JVM of the Management Center using the following command line parameters:
-
-Dhazelcast.mc.httpClient.tls.trustStore: Path to the truststore. -
-Dhazelcast.mc.httpClient.tls.trustStorePassword: Password of the truststore. -
-Dhazelcast.mc.httpClient.tls.trustStoreType: Type of the truststore. Its default value is JKS. -
-Dhazelcast.mc.httpClient.tls.trustManagerAlgorithm: Name of the algorithm based on which the authentication keys are provided. System default is used if none is provided. You can find out the default by calling thejavax.net.ssl.TrustManagerFactory#getDefaultAlgorithmmethod.
| You can encrypt the truststore password and pass it as a command line argument in encrypted form for improved security. See the Variable Replacers section for more information. |
By default, JVM also checks for the validity of the hostname of the certificate. If this test fails, you will see a line similar to the following in the Management Center logs:
javax.net.ssl.SSLHandshakeException: java.security.cert.CertificateException:
No subject alternative names matching IP address 127.0.0.1 found
If you want to disable this check, start the Management Center with the following command line parameter:
-Dhazelcast.mc.disableHostnameVerification=true3.7.3. Mutual Authentication
Mutual authentication allows cluster members to have their keystores and the Management Center to have its truststore so that the Management Center can know which members it can trust. To enable mutual authentication, you need to use the following command line parameters when starting the Management Center:
-Dhazelcast.mc.tls.mutualAuthentication=REQUIREDOn the member side, you need to set the following JVM arguments when starting the member:
-Djavax.net.ssl.keyStore=path to your keystore -Djavax.net.ssl.keyStorePassword=yourpasswordSee the below example snippet to see the full command to start the Management Center:
java -Dhazelcast.mc.tls.enabled=true
-Dhazelcast.mc.tls.keyStore=path to your keystore
-Dhazelcast.mc.tls.keyStorePassword=password for your keystore
-Dhazelcast.mc.tls.trustStore=path to your truststore
-Dhazelcast.mc.tls.trustStorePassword=password for your truststore
-Dhazelcast.mc.tls.mutualAuthentication=REQUIRED -jar hazelcast-mancenter-3.12.15.war
And the full command to start the cluster member:
java -Djavax.net.ssl.keyStore=path to your keystore
-Djavax.net.ssl.keyStorePassword=yourpassword
-Djavax.net.ssl.trustStore=path to your truststore
-Djavax.net.ssl.trustStorePassword=yourpassword -jar hazelcast.jar
The parameter -Dhazelcast.mc.tls.mutualAuthentication has two options:
-
REQUIRED: If the cluster member does not provide a keystore or the provided keys are not included in the Management Center’s truststore, the cluster member will not be authenticated. -
OPTIONAL: If the cluster member does not provide a keystore, it will be authenticated. But if the cluster member provides keys that are not included in the Management Center’s truststore, the cluster member will not be authenticated.
Managing Mutual Authentication Enabled Clusters
If mutual authentication is enabled for the cluster (as described here), the Management Center needs to have a keystore to identify itself. For this, you need to start the Management Center with the following command line parameters:
-
-Dhazelcast.mc.httpClient.tls.keyStore: Path to the keystore. -
-Dhazelcast.mc.httpClient.tls.keyStorePassword: Password of the keystore. -
-Dhazelcast.mc.httpClient.tls.keyStoreType: Type of the keystore. Its default value is JKS. -
-Dhazelcast.mc.httpClient.tls.keyManagerAlgorithm: Name of the algorithm based on which the authentication keys are provided. System default is used if none is provided. You can find out the default by calling thejavax.net.ssl.KeyManagerFactory#getDefaultAlgorithmmethod.
Excluding Specific TLS/SSL Protocols
When you enable TLS on the Management Center, it will support the clients
connecting with any of the TLS/SSL protocols that the JVM supports by default.
In order to disable specific protocols, you need to set the -Dhazelcast.mc.tls.excludeProtocols
command line argument to a comma separated list of protocols to be excluded from the
list of supported protocols. For example, to allow only TLSv1.2, you need to add
the following command line argument when starting the Management Center:
-Dhazelcast.mc.tls.excludeProtocols=SSLv3,SSLv2Hello,TLSv1,TLSv1.1When you specify the above argument, you should see a line similar to the following in the Management Center log:
2017-06-21 12:35:54.856:INFO:oejus.SslContextFactory:Enabled Protocols
[TLSv1.2] of [SSLv2Hello, SSLv3, TLSv1, TLSv1.1, TLSv1.2]
3.7.4. Using a Dictionary to Prevent Weak Passwords
In order to prevent certain words from being included in the user
passwords, you can start the Management Center with -Dhazelcast.mc.security.dictionary.path
command line parameter which points to a text file that contains a word
on each line. As a result, the user passwords will not contain any dictionary
words, making them harder to guess.
The words in the dictionary need to be at least three characters long in order to
be used for checking the passwords. The shorter
words are ignored to prevent them from blocking the usage of many password
combinations. You can configure
the minimum length of words by starting the Management Center with
-Dhazelcast.mc.security.dictionary.minWordLength
command line parameter and setting it to a number.
An example to start the Management Center using the aforementioned parameters is shown below:
java -Dhazelcast.mc.security.dictionary.path=/usr/MCtext/pwd.txt
-Dhazelcast.mc.security.dictionary.minWordLength=3 -jar hazelcast-mancenter-3.12.15.war
3.7.5. Including and/or Excluding Specific Cipher Suites
When you configure TLS you also can provide which cipher suites Management Center can use
for establishing TLS connection. You can include cipher suites with -Dhazelcast.mc.include.cipher.suites
and exclude with -Dhazelcast.mc.exclude.cipher.suites system properties during
Management Center startup. You can use the exact cipher suite name or a regular expression.
For example:
"-Dhazelcast.mc.include.cipher.suites=^SSL_.*$"
"-Dhazelcast.mc.exclude.cipher.suites=^.*_(MD5|SHA|SHA1)$,^TLS_RSA_.*$,^.*_NULL_.*$"
3.8. Configuring Logging
The Management Center uses Logback for its logging. By default, it uses the following configuration:
<?xml version="1.0" encoding="UTF-8"?>
<configuration>
    <appender name="STDOUT" class="ch.qos.logback.core.ConsoleAppender">
        <layout class="ch.qos.logback.classic.PatternLayout">
            <Pattern>
                %d{yyyy-MM-dd HH:mm:ss} [%thread] %-5level %logger{36} - %msg%n
            </Pattern>
        </layout>
    </appender>

    <root level="INFO">
        <appender-ref ref="STDOUT"/>
    </root>
</configuration>
To change the logging configuration, you can create a custom
Logback configuration file and start the Management Center with
the -Dlogback.configurationFile option pointing to your configuration file.
For example, you can create a file named logback-custom.xml with the following
content and set logging level to DEBUG.
To use this file as the logging configuration, you need to start the Management Center with the
-Dlogback.configurationFile=/path/to/your/logback-custom.xml command line parameter:
<?xml version="1.0" encoding="UTF-8"?>
<configuration>
    <appender name="STDOUT" class="ch.qos.logback.core.ConsoleAppender">
        <layout class="ch.qos.logback.classic.PatternLayout">
            <Pattern>
                %d{yyyy-MM-dd HH:mm:ss} [%thread] %-5level %logger{36} - %msg%n
            </Pattern>
        </layout>
    </appender>

    <root level="DEBUG">
        <appender-ref ref="STDOUT"/>
    </root>
</configuration>
3.8.1. Enabling Audit Logging
You may enable additional security audit logging by setting the hazelcast.mc.auditlog.enabled
system property to true. Log entries from the audit logging will be marked with
the hazelcast.auditlog logging category.
An example log entry looks like the following:
2019-11-05 12:16:48 [qtp1551870003-37] INFO hazelcast.auditlog - MC-2001 [Auth]:User logged in:{username=JohnHallaign}MC-2001 [Auth] you see in this example represents the log’s type.
The following table lists the current log categories along with their
types:
| Event Category | Log Type/Description |
|---|---|
Management Center Configuration Logs |
|
Cluster Configuration Logs |
|
Authentication Logs |
|
Scripting Logs |
|
Console Logs |
|
Map/Cache Logs |
|
Hot Restart Logs |
|
WAN Replication Logs |
|
CP Subsystem Logs |
|
To write security audit logging into separate rolling log files, you can use a similar Logback configuration file:
<?xml version="1.0" encoding="UTF-8"?>
<configuration>
    <property name="pattern" value="%d{yyyy-MM-dd HH:mm:ss} [%thread] %-5level %logger{36} - %msg%n" />

    <appender name="STDOUT" class="ch.qos.logback.core.ConsoleAppender">
        <encoder>
            <pattern>${pattern}</pattern>
        </encoder>
    </appender>

    <appender name="AUDIT_FILE" class="ch.qos.logback.core.rolling.RollingFileAppender">
        <file>${user.home}/mc-logs/audit.log</file>
        <!-- daily rollover with last 30 days history -->
        <rollingPolicy class="ch.qos.logback.core.rolling.TimeBasedRollingPolicy">
            <fileNamePattern>${user.home}/mc-logs/audit.%d{yyyy-MM-dd}.log</fileNamePattern>
            <maxHistory>30</maxHistory>
        </rollingPolicy>
        <encoder>
            <pattern>${pattern}</pattern>
        </encoder>
    </appender>

    <logger level="INFO" name="hazelcast.auditlog">
        <appender-ref ref="AUDIT_FILE"/>
    </logger>

    <root level="INFO">
        <appender-ref ref="STDOUT"/>
    </root>
</configuration>
3.9. Configuring SMTP Timeouts
You can configure the SMTP timeout for the outgoing email alerts using the following system properties:
-
-Dhazelcast.mc.mail.connectiontimeoutsets the socket connection timeout for initiating the SMTP session, in milliseconds. Its default value is 7000. -
-Dhazelcast.mc.mail.timeoutsets the socket read timeout during the session, in milliseconds. Its default value is 7000.
3.10. Using Variable Replacers
Variable replacers are used to replace custom strings during loading
the configuration, either passed as command line
arguments or as part of a configuration file, such as ldap.properties or
jaas.properties. They can be used to mask
sensitive information such as usernames and passwords. Of course their
usage is not limited to security related information.
Variable replacers implement the interface com.hazelcast.webmonitor.configreplacer.spi.ConfigReplacer
and they are configured via the following command line arguments:
-
-Dhazelcast.mc.configReplacer.class: Full class name of the replacer. -
-Dhazelcast.mc.configReplacer.failIfValueMissing: Specifies whether the loading configuration process stops when a replacement value is missing. It is an optional attribute and its default value istrue. -
Additional command line arguments specific to each replacer implementation. All of the properties for the built-in replacers are explained in the upcoming sections.
The following replacer classes are provided by Hazelcast as example
implementations of the ConfigReplacer interface.
Note that you can also implement your own replacers.
-
EncryptionReplacer -
PropertyReplacer
Each example replacer is explained in the following sections.
3.10.1. EncryptionReplacer
This example EncryptionReplacer replaces the encrypted variables with
its plain form. The secret key for encryption/decryption is generated from a
password which can be a value in a file and/or environment specific values,
such as MAC address and actual user data.
Its full class name is com.hazelcast.webmonitor.configreplacer.EncryptionReplacer
and the replacer prefix is ENC. Here are the properties used to configure
this example replacer:
-
hazelcast.mc.configReplacer.prop.cipherAlgorithm: Cipher algorithm used for the encryption/decryption. Its default value is AES. -
hazelcast.mc.configReplacer.prop.keyLengthBits: Length (in bits) of the secret key to be generated. Its default value is 128. -
hazelcast.mc.configReplacer.prop.passwordFile: Path to a file whose content should be used as a part of the encryption password. When the property is not provided, no file is used as a part of the password. Its default value is null. -
hazelcast.mc.configReplacer.prop.passwordNetworkInterface: Name of the network interface whose MAC address should be used as a part of the encryption password. When the property is not provided no network interface property is used as a part of the password. Its default value is null. -
hazelcast.mc.configReplacer.prop.passwordUserProperties: Specifies whether the current user properties (user.nameanduser.home) should be used as a part of the encryption password. Its default value is true. -
hazelcast.mc.configReplacer.prop.saltLengthBytes: Length (in bytes) of a random password salt. Its default value is 8. -
hazelcast.mc.configReplacer.prop.secretKeyAlgorithm: Name of the secret key algorithm to be associated with the generated secret key. Its default value is AES. -
hazelcast.mc.configReplacer.prop.secretKeyFactoryAlgorithm: Algorithm used to generate a secret key from a password. Its default value is PBKDF2WithHmacSHA256. -
hazelcast.mc.configReplacer.prop.securityProvider: Name of a Java Security Provider to be used for retrieving the configured secret key factory and the cipher. Its default value is null.
| Older Java versions may not support all the algorithms used as defaults. Use the property values supported by your Java version. |
As a usage example, let’s create a password file and generate the encrypted strings out of this file as shown below:
-
Create the password file:
echo '/Za-uG3dDfpd,5.-' > /opt/master-password -
Define the encrypted variables:
java -cp hazelcast-mancenter-3.12.15.war \ -Dhazelcast.mc.configReplacer.prop.passwordFile=/opt/master-password \ -Dhazelcast.mc.configReplacer.prop.passwordUserProperties=false \ com.hazelcast.webmonitor.configreplacer.EncryptionReplacer \ "aPasswordToEncrypt" \ Output: $ENC{wJxe1vfHTgg=:531:WkAEdSi//YWEbwvVNoU9mUyZ0DE49acJeaJmGalHHfA=} -
Configure the replacer and provide the encrypted variables as command line arguments while starting the Management Center:
java \
-Dhazelcast.mc.configReplacer.class=com.hazelcast.webmonitor.configreplacer.EncryptionReplacer \
-Dhazelcast.mc.configReplacer.prop.passwordFile=/opt/master-password \
-Dhazelcast.mc.configReplacer.prop.passwordUserProperties=false \
-Dhazelcast.mc.tls.enabled=true \
-Dhazelcast.mc.tls.keyStore=/opt/mancenter.keystore \
-Dhazelcast.mc.tls.keyStorePassword='$ENC{wJxe1vfHTgg=:531:WkAEdSi//YWEbwvVNoU9mUyZ0DE49acJeaJmGalHHfA=}' \
-jar hazelcast-mancenter-3.12.15.war
3.10.2. PropertyReplacer
PropertyReplacer replaces variables by properties with the given name.
Usually the system properties are used, e.g., ${user.name}.
Its full class name is com.hazelcast.webmonitor.configreplacer.PropertyReplacer
and the replacer prefix is empty string ("").
3.10.3. Implementing Custom Replacers
You can also provide your own replacer implementations. All replacers have to implement the three methods that have the same signatures as the methods of the following interface:
import java.util.Properties;

public interface ConfigReplacer {
    void init(Properties properties);
    String getPrefix();
    String getReplacement(String maskedValue);
}
4. Connecting Members to Management Center
After you start and/or configure the Management Center service
as explained in the Starting the Management Center Service and
Configuring the Management Center chapters, make sure that
http://localhost:8080/hazelcast-mancenter is up.
Configure your Hazelcast members by adding the URL of your web application
to your hazelcast.xml. Hazelcast IMDG cluster members send their states to this URL.
<management-center enabled="true">
    http://localhost:8080/hazelcast-mancenter
</management-center>
You can configure it programmatically as follows:
Config config = new Config();
config.getManagementCenterConfig().setEnabled(true);
config.getManagementCenterConfig().setUrl("http://localhost:8080/hazelcast-mancenter");

HazelcastInstance hz = Hazelcast.newHazelcastInstance(config);
If you enabled TLS/SSL on the Management Center, then you need to configure the members with the relevant keystore and truststore. In that case you expand the above configuration as follows:
<management-center enabled="true">
  <url>https://localhost:sslPortNumber/hazelcast-mancenter</url>
  <mutual-auth enabled="true">
    <factory-class-name>
        com.hazelcast.nio.ssl.BasicSSLContextFactory
    </factory-class-name>
    <properties>
        <property name="keyStore">keyStore</property>
        <property name="keyStorePassword">keyStorePassword</property>
        <property name="trustStore">trustStore</property>
        <property name="trustStorePassword">trustStorePassword</property>
        <property name="protocol">TLS</property>
    </properties>
  </mutual-auth>
</management-center>
In the example above, Hazelcast’s default SSL context factory (BasicSSLContextFactory) is used; you can also provide your own implementation of this factory.
Here are the descriptions for the properties:
-
keystore: Path to your keystore file. Note that your keystore’s type must be JKS.
-
keyStorePassword: Password to access the key from your keystore file.
-
keyManagerAlgorithm: Name of the algorithm based on which the authentication keys are provided.
-
keyStoreType: The type of the keystore. Its default value is JKS.
-
truststore: Path to your truststore file. The file truststore is a keystore file that contains a collection of certificates trusted by your application. Its type should be JKS.
-
trustStorePassword: Password to unlock the truststore file.
-
trustManagerAlgorithm: Name of the algorithm based on which the trust managers are provided.
-
trustStoreType: The type of the truststore. Its default value is JKS.
-
protocol: Name of the algorithm which is used in your TLS/SSL. Its default value is TLS. Available values are:
-
SSL
-
SSLv2
-
SSLv3
-
TLS
-
TLSv1
-
TLSv1.1
-
TLSv1.2
-
See the programmatic configuration example below:
Config config = new Config();
SSLContextFactory factory = new BasicSSLContextFactory();

MCMutualAuthConfig mcMutualAuthConfig = new MCMutualAuthConfig().setEnabled(true).setFactoryImplementation(factory)
        .setProperty("keyStore", "/path/to/keyStore")
        .setProperty("keyStorePassword", "password")
        .setProperty("keyManagerAlgorithm", "SunX509")
        .setProperty("trustStore", "/path/to/truststore")
        .setProperty("trustStorePassword", "password")
        .setProperty("trustManagerAlgorithm", "SunX509");

ManagementCenterConfig mcc = new ManagementCenterConfig()
    .setEnabled(true)
    .setMutualAuthConfig(mcMutualAuthConfig)
    .setUrl("https://localhost:8443/hazelcast-mancenter");

config.setManagementCenterConfig(mcc);

HazelcastInstance hz = Hazelcast.newHazelcastInstance(config);| For the protocol property, we recommend you to provide SSL or TLS with its version information, e.g., TLSv1.2. Note that if you write only SSL or TLS, your application chooses the SSL or TLS version according to your Java version. |
Now you can start your Hazelcast cluster, browse to http://localhost:8080/hazelcast-mancenter
or https://localhost:sslPortNumber/hazelcast-mancenter (depending on installation) and
setup your administrator account explained in the Getting Started chapter.
4.1. Communication Between Members and Management Center
Hazelcast IMDG cluster members and Management Center talk to each other for the following situations:
-
When the members send statistics
-
When the members perform operations that are waiting in the Management Center’s queue
-
When the Management Center sends commands to the members
This section describes the first two situations. For the third one, see the Executing Console Commands section.
Hazelcast members send their statistics to the Management Center by opening an HTTP connection as configured on the member side, as shown below:
<hazelcast>
    ...
    <management-center enabled="true">http://localhost:8080/hazelcast-mancenter</management-center>
    ...
</hazelcast>
This communication starts at an ephemeral port on the member and goes to the port 8080 of the Management Center. This connection can also be configured to have TLS/SSL in which case it typically uses the port 8443 on the Management Center. See the previous section for more information on this.
In addition to the statistics, the other communication path is when the members query the Management Center to see if there are any operations to be performed. The Management Center has a command queue, and the members open an HTTP connection to the Management Center for this purpose. If there are operations for a member, then it fetches those, runs the operations and then makes another HTTP request to the Management Center for putting the responses. As it is in sending the statistics, this communication also starts at an ephemeral port on the member and goes to the port 8080 of the Management Center.
5. Launching the Management Center User Interface
If you have the open source edition of Hazelcast IMDG, the Management Center can be used for at most three members in the cluster. To use it for more members, you need to have either a Management Center license, Hazelcast IMDG Enterprise license or Hazelcast IMDG Enterprise HD license. The license should be entered within the Management Center as described in the following paragraphs.
| Even if you have a Hazelcast IMDG Enterprise or Enterprise HD license key and you set it as explained in the Setting the License Key section, you still need to enter this same license within the Management Center. See the following paragraphs to learn how you can enter your license. |
Once you browse to http://localhost:8080/hazelcast-mancenter and since
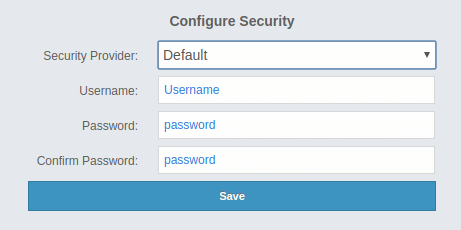
you are going to use the Management Center for the first time, the following dialog box appears:
| If you already configured security before, a login dialog box appears instead. |
It asks you to choose your security provider and create a username and password. Available security providers are Default, Active Directory, LDAP and JAAS, which are described in the following sections.
Once you press the Save button, your security provider configuration is saved and you can log in with your credentials.
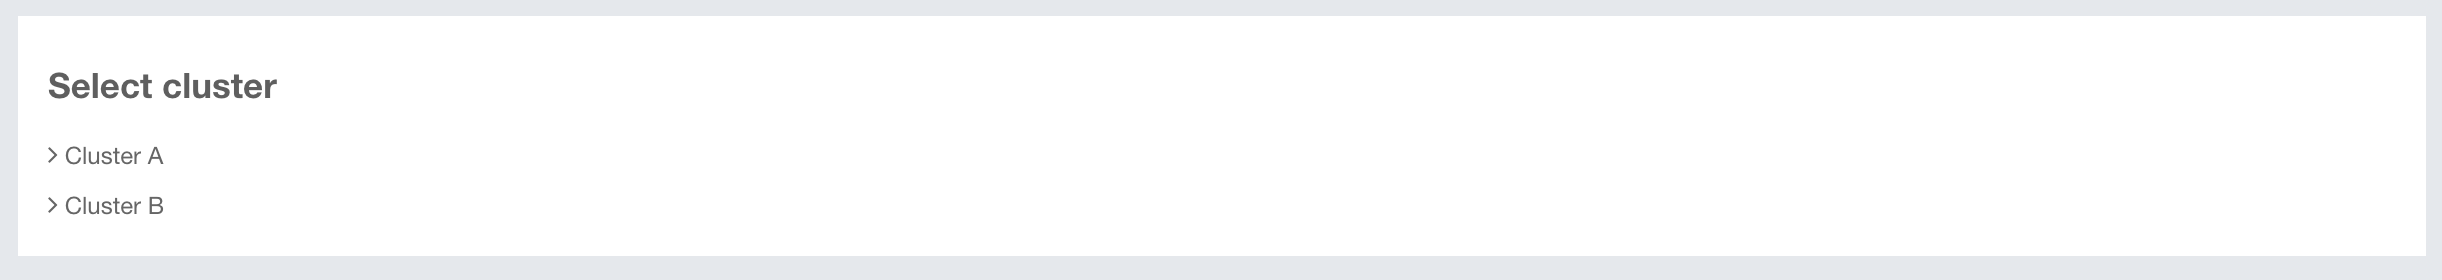
If you have more than one cluster that send statistics to the Management Center, you can select a cluster to connect by clicking on its name from the list. Otherwise, you will connect to the only cluster that sends statistics automatically upon logging in.
| The Management Center can be used without a license if the cluster that you want to monitor has at most three members. |
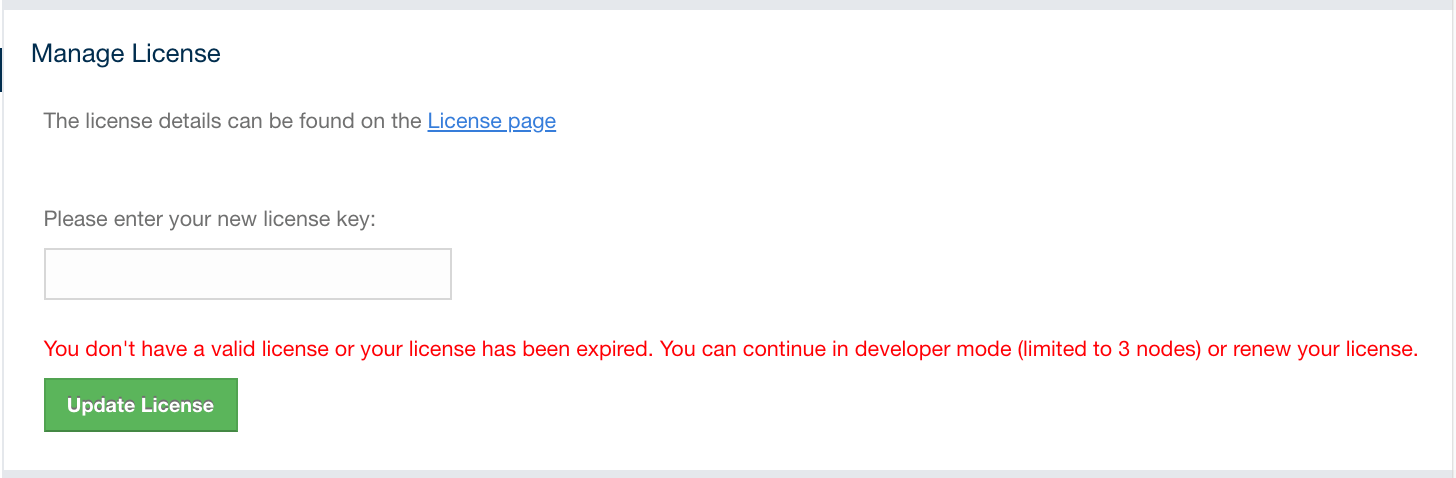
If you have a Management Center license or Hazelcast IMDG Enterprise license, you can enter it by clicking on the Administration button on the left menu and opening the Manage License tab. Here you can enter your license key and press the Update License button, as shown below:
Note that a license can likewise be provided using the system property
hazelcast.mc.license (see the Starting with a License for details).
When you try to connect to a cluster that has more than three members without entering a license key or if your license key is expired, the following warning message is shown at the top:

If you choose to continue without a license, please remember that the Management Center works if your cluster has at most three members.
The Management Center creates a folder with the name hazelcast-mc under your user’s home
folder to save data files and above settings/license information. You can change the data
folder by setting the hazelcast.mc.home system property.
6. Authentication Options
6.1. Default Authentication
You can use the default security provider for authentication/authorization on the Management Center. In this case, the user accounts are stored in the Management Center’s database.
Provide the details in this form for the default security provider:
-
Username: Username for the initial administrator user account.
-
Password, Confirm Password: Password for the initial administrator user account.
You can also use the create-user command in the MC Conf tool to configure
the default security provider without any UI interactions. See this command’s
description for details.
|
6.2. Active Directory Authentication
You can use your existing Active Directory server for authentication/authorization on the Management Center. In the "Configure Security" page, select Active Directory from the "Security Provider" combo box, and the following form page appears:
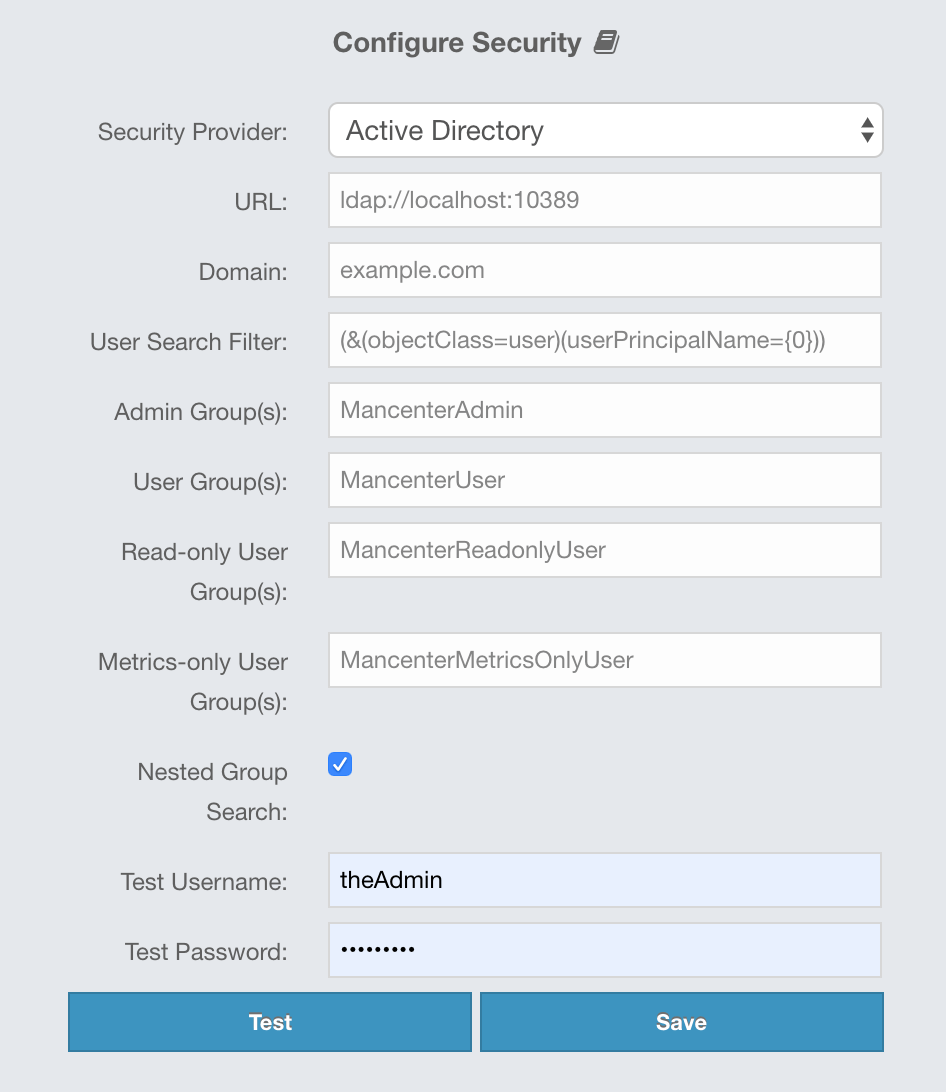
Provide the details in this form for your Active Directory server:
-
URL: URL of your Active Directory server, including the schema (
ldap://orldaps://) and port. -
Domain: Domain of your organization on Active Directory.
-
User Search Filter: LDAP search filter expression to search for the users.
{0}will be replaced withusername@domainand{1}will be replaced with only theusername. You can use both placeholders, only one of them or none in your search filter. For example,(&(objectClass=user)(userPrincipalName={0}))searches for a username that matches with theuserPrincipalNameattribute and member of the object classuser. -
Admin Group(s): Members of this group and its nested groups have admin privileges on the Management Center. To use more than one group, separate them with a semicolon (;).
-
User Group(s): Members of this group and its nested groups have read and write privileges on the Management Center. To use more than one group, separate them with a semicolon (;).
-
Read-only User Group(s): Members of this group and its nested groups have only read privilege on the Management Center. To use more than one group, separate them with a semicolon (;).
-
Metrics-only Group(s): Members of this group and its nested groups have the privilege to see only the metrics on Management Center. To use more than one group, separate them with a semicolon (;).
-
Nested Group Search: Disable if you have a large LDAP group structure and it takes a long time to query all nested groups during login.
-
Test Username: Username to test the Active Directory configuration with. Note that this value will not be saved and only be used for testing the Active Directory configuration.
-
Test Password: Password to test the Active Directory configuration with. Note that this value will not be saved and only be used for testing the Active Directory configuration.
Before saving the configuration, you can test it by clicking the Test button. Note that the user you test with needs to be a member of one of the groups you have configured for the Management Center.
Once configured, Active Directory settings are saved in a file named
ldap.properties under the hazelcast-mc directory mentioned in the
previous section. If you want to update your settings afterwards, you
need to update ldap.properties file and click Reload Security Config
button on the login page.
You can use the hazelcast.mc.ldap.timeout system property to
specify both connect and read timeout values for Active Directory search
queries. It is in milliseconds and its default value is 3000 milliseconds.
|
6.3. JAAS Authentication
You can use your own javax.security.auth.spi.LoginModule implementation
for authentication/authorization on the Management Center. In the "Configure Security"
page, select JAAS from the "Security Provider" combo box, and the following
page appears:
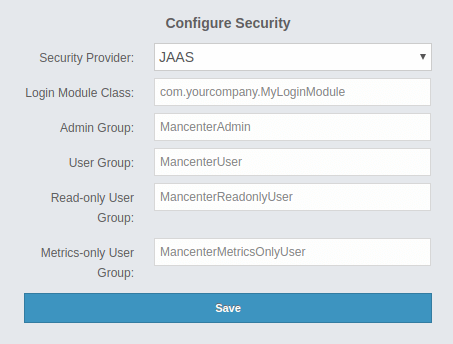
Provide the details in this form for your JAAS LoginModule implementation:
-
Login Module Class: Fully qualified class name of your
javax.security.auth.spi.LoginModuleimplementation. -
Admin Group: Members of this group have admin privileges on the Management Center.
-
User Group: Members of this group have read and write privileges on the Management Center.
-
Read-only User Group: Members of this group have only read privilege on the Management Center.
-
Metrics-only Group: Members of this group have the privilege to see only the metrics on the Management Center.
The following is an example implementation. Note that we return two java.security.Principal
instances; one of them is the username and the other one is a group name, which
you will use when configuring JAAS security as described above.
import javax.security.auth.Subject;
import javax.security.auth.callback.Callback;
import javax.security.auth.callback.CallbackHandler;
import javax.security.auth.callback.NameCallback;
import javax.security.auth.callback.PasswordCallback;
import javax.security.auth.login.LoginException;
import javax.security.auth.spi.LoginModule;
import java.security.Principal;
import java.util.Map;

public class SampleLoginModule implements LoginModule {
    private Subject subject;
    private String password;
    private String username;

    @Override
    public void initialize(Subject subject, CallbackHandler callbackHandler, Map<String, ?> sharedState, Map<String, ?> options) {
        this.subject = subject;

        try {
            NameCallback nameCallback = new NameCallback("prompt");
            PasswordCallback passwordCallback = new PasswordCallback("prompt", false);

            callbackHandler.handle(new Callback[] {nameCallback, passwordCallback });

            password = new String(passwordCallback.getPassword());
            username = nameCallback.getName();
        } catch (Exception e) {
            throw new RuntimeException(e);
        }
    }

    @Override
    public boolean login() throws LoginException {
        if (!username.equals("emre")) {
            throw new LoginException("Bad User");
        }

        if (!password.equals("pass1234")) {
            throw new LoginException("Bad Password");
        }

        subject.getPrincipals().add(new Principal() {
            public String getName() {
                return "emre";
            }
        });

        subject.getPrincipals().add(new Principal() {
            public String getName() {
                return "MancenterAdmin";
            }
        });

        return true;
    }

    @Override
    public boolean commit() throws LoginException {
        return true;
    }

    @Override
    public boolean abort() throws LoginException {
        return true;
    }

    @Override
    public boolean logout() throws LoginException {
        return true;
    }
}
6.4. LDAP Authentication
You can use your existing LDAP server for authentication/authorization on the Management Center. In the "Configure Security" page, select LDAP from the "Security Provider" combo box, and the following form page appears:
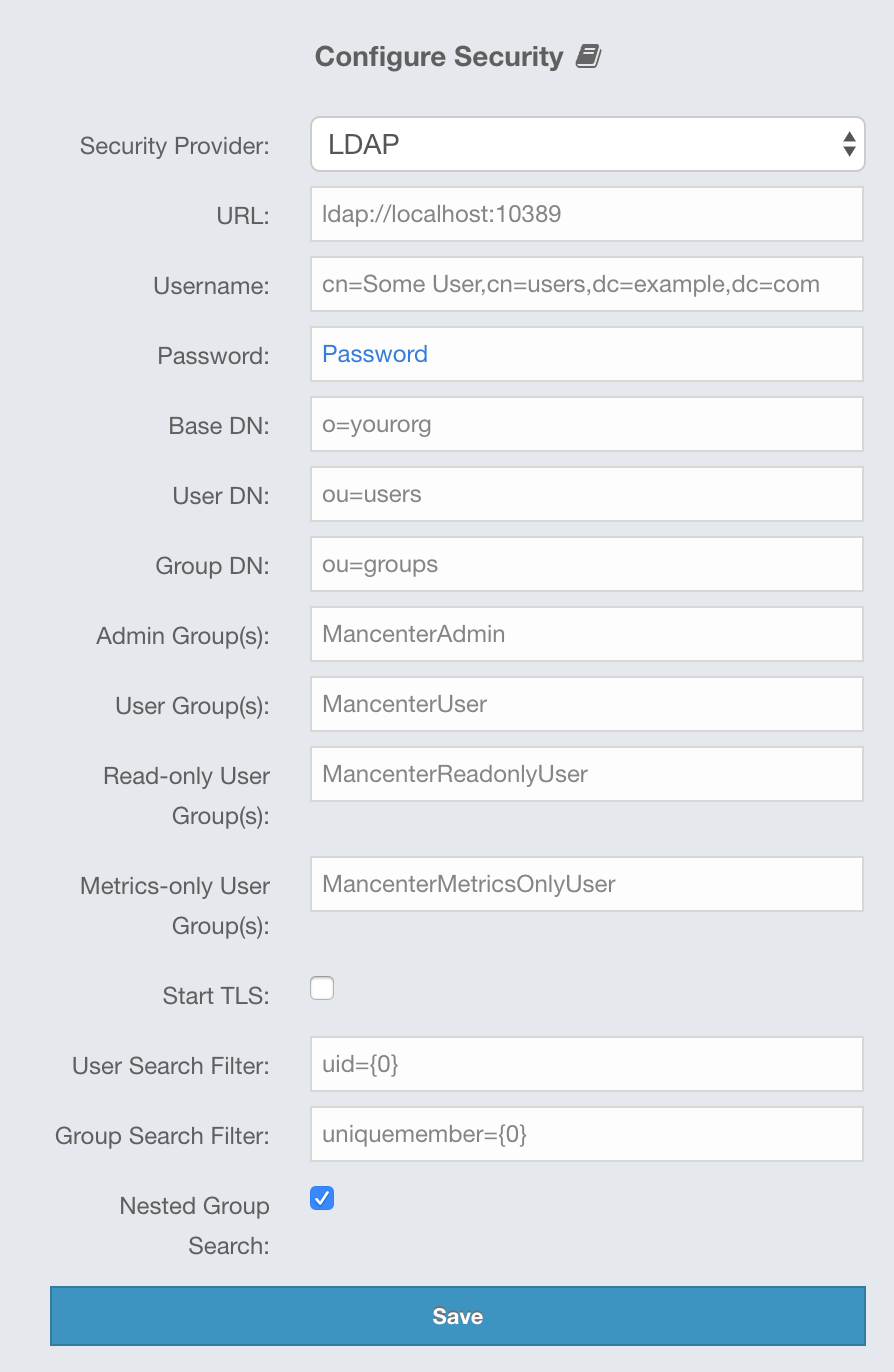
Provide the details in this form for your LDAP server:
-
URL: URL of your LDAP server, including schema (
ldap://orldaps://) and port. -
Distinguished name (DN) of user: DN of a user that has admin privileges on the LDAP server. It is used to connect to the server when authenticating users.
-
Search base DN: Base DN to be used for searching users/groups.
-
Additional user DN: Appended to "Search base DN" and used for finding users.
-
Additional group DN: Appended to "Search base DN" and used for finding groups.
-
Admin Group(s): Members of this group and its nested groups have admin privileges on the Management Center. To use more than one group, separate them with a semicolon (;).
-
User Group(s): Members of this group and its nested groups have read and write privileges on the Management Center. To use more than one group, separate them with a semicolon (;).
-
Read-only User Group(s): Members of this group and its nested groups have only read privilege on the Management Center. To use more than one group, separate them with a semicolon (;).
-
Metrics-only Group(s): Members of this group and its nested groups have the privilege to see only the metrics on the Management Center. To use more than one group, separate them with a semicolon (;).
-
Start TLS: Enable if your LDAP server uses Start TLS operation.
-
User Search Filter: LDAP search filter expression to search for the users. For example,
uid={0}searches for a username that matches with theuidattribute. -
Group Search Filter: LDAP search filter expression to search for the groups. For example,
uniquemember={0}searches for a group that matches with theuniquememberattribute. -
Nested Group Search: Disable if you have a large LDAP group structure and it takes a long time to query all nested groups during login.
Values for Admin, User, Read-only and Metrics-Only group names must
be given as plain names. They should not contain any LDAP attributes such
as CN, OU and DC.
|
Once configured, LDAP settings are saved in a file named ldap.properties
under the hazelcast-mc directory mentioned in the previous section. If you
want to update your settings afterwards, you need to update the ldap.properties
file and click on the Reload Security Config button on the login page.
You can use the hazelcast.mc.ldap.timeout system property to
specify connect and read timeout values for LDAP search queries.
It is in milliseconds and its default value is 3000 milliseconds.
|
6.4.1. Enabling TLS/SSL for Active Directory
If your Active Directory service is using TLS/SSL protocol, use the following command line parameters for your Management Center deployment:
-
-Djavax.net.ssl.trustStore: Path to the truststore. -
-Djavax.net.ssl.trustStorePassword: Password of the truststore.
These properties override the cacerts with your own truststore.
6.4.2. Enabling TLS/SSL for LDAP
If your LDAP server is using ldaps (LDAP over SSL) protocol or the Start
TLS operation, use the following command line
parameters for your Management Center deployment:
-
-Dhazelcast.mc.ldap.ssl.trustStore: Path to the truststore. This truststore needs to contain the public key of your LDAP server. -
-Dhazelcast.mc.ldap.ssl.trustStorePassword: Password of the truststore. -
-Dhazelcast.mc.ldap.ssl.trustStoreType: Type of the truststore. Its default value is JKS. -
-Dhazelcast.mc.ldap.ssl.trustManagerAlgorithm: Name of the algorithm based on which the authentication keys are provided. System default is used if none is provided. You can find out the default by calling thejavax.net.ssl.TrustManagerFactory#getDefaultAlgorithmmethod.
6.4.3. Password Encryption
By default, the password that you use in the LDAP configuration is saved on the
ldap.properties file in clear text. This might pose a security risk. To
store the LDAP password in an encrypted form, we offer the following options:
-
Provide a keystore password: This creates and manages a Java keystore under the Management Center home directory. The LDAP password is stored in this keystore in an encrypted form.
-
Configure an external Java keystore: This uses an existing Java keystore. This option might also be used to store the password in an HSM that provides a Java keystore API.
In the case of using either one of the options, the LDAP password you
enter on the initial configuration UI dialog will be stored in
an encrypted form in a Java keystore instead of the
ldap.properties file.
You can also encrypt the password before saving it on ldap.properties.
See the Variable Replacers section for more information.
|
Providing a Master Key for Encryption
There are two ways to provide a master key for encryption:
-
If you deploy the Management Center on an application server, you need to set the
MC_KEYSTORE_PASSenvironment variable before starting Management Center. This option is less secure. You should clear the environment variable once you make sure you can log in with your LDAP credentials to minimize the security risk. -
If you’re starting the Management Center from the command line, you can start it with
-Dhazelcast.mc.askKeyStorePassword. The Management Center asks for the keystore password upon start and use it as a password for the keystore it creates. This option is more secure as it only stores the keystore password in the memory.
By default, the Management Center creates a Java keystore file under the
Management Center home directory with the name mancenter.jceks. You can
change the location of this file by using the
-Dhazelcast.mc.keyStore.path=/path/to/keyStore.jceks JVM argument.
Configuring an External Java KeyStore
If you don’t want the Management Center to create a keystore for you and use an existing one that you’ve created before (or an HSM), set the following JVM arguments when starting the Management Center:
-
-Dhazelcast.mc.useExistingKeyStore=true: Enables use of an existing keystore. -
-Dhazelcast.mc.existingKeyStore.path=/path/to/existing/keyStore.jceks: Path to the keystore. You do not have to set it if you use an HSM. -
-Dhazelcast.mc.existingKeyStore.pass=somepass: Password for the keystore. You do not have to set it if HSM provides another means to unlock HSM. -
-Dhazelcast.mc.existingKeyStore.type=JCEKS: Type of the keystore. -
-Dhazelcast.mc.existingKeyStore.provider=com.yourprovider.MyProvider: Provider of the keystore. Leave empty to use the system provider. Specify the class name of your HSM’sjava.security.Providerimplementation if you use an HSM.
| Make sure your keystore supports storing `SecretKey`s. |
6.4.4. Updating Encrypted Passwords
You can use the update-ldap-password command in the MC Conf tool to update
the encrypted LDAP password stored in the keystore. See this command’s
description for details.
6.5. SAML Authentication
You can use SAML single sign-on with Management Center. In the "Configure Security" page, select SAML from the "Security Provider" combo box, and the following form page appears:
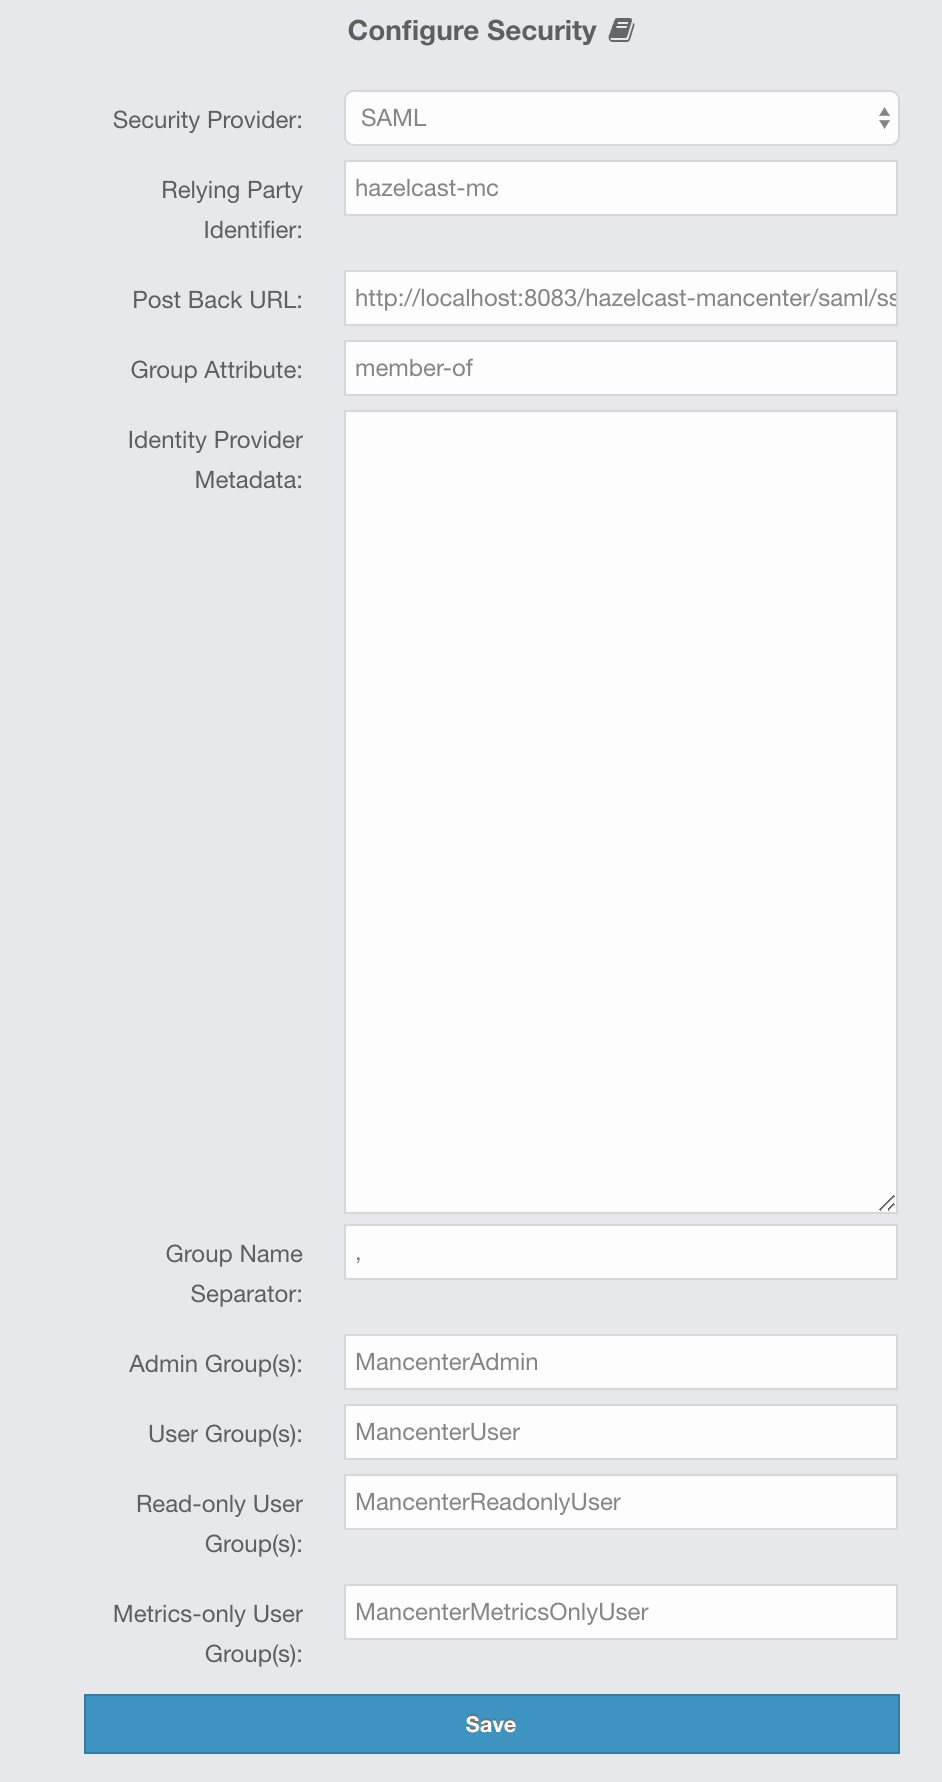
Provide the details in this form for SAML:
-
Relying Party Identifier: The application-defined unique identifier that is the intended audience of the SAML assertion. This is most often the Service Provider Entity ID of your application.
-
Post Back URL: URL of the Management Center SAML assertion consumer, including schema (
http://orhttps://) and port. Assertion consumer is located under the path/saml/ssoso you should append/saml/ssoto the Management Center URL. Your Identity Provider should have access to this URL as it will post back SAML responses to it. For example, if Management Center and the Identity Provider are on the same machine, you would enter “http://127.0.0.1:8080/hazelcast-mancenter/saml/sso”. -
Group Attribute: Name of the attribute that contains group of the user.
-
Identity Provider Metadata: Your Identity Provider’s metadata in XML format.
-
Group Name Separator: Separator for the group names in case the group attribute value contains more than one group.
-
Admin Group(s): Members of this group have admin privileges on the Management Center. To use more than one group, separate them with the group name separator you have configured.
-
User Group(s): Members of this group have read and write privileges on the Management Center. To use more than one group, separate them with the group name separator you have configured.
-
Read-only User Group(s): Members of this group have only read privilege on the Management Center. To use more than one group, separate them with the group name separator you have configured.
-
Metrics-only Group(s): Members of this group have the privilege to see only the metrics on the Management Center. To use more than one group, separate them with the group name separator you have configured.
| If the user has more than one authority, Management Center uses the highest one. |
Once you configure SAML, a button for single sign-on will be shown in the login page. Clicking it will start the SAML single sign-on process. If you don’t have an existing session with your Identity Provider, you will be taken to the login page of your Identity Provider. Once you log into your Identity Provider, you will be redirected back to Management Center as a logged in user.
| If your Identity Provider needs service provider metadata XML, you can use the following URL to view/download it once you configure SAML: “http://<MC URL>/hazelcast-mancenter/saml/metadata”. |
6.6. OpenID Connect Authentication
You can use OpenID Connect single sign-on with Management Center. In the "Configure Security" page, select OpenID Connect from the "Security Provider" combo box, and the following form page appears:
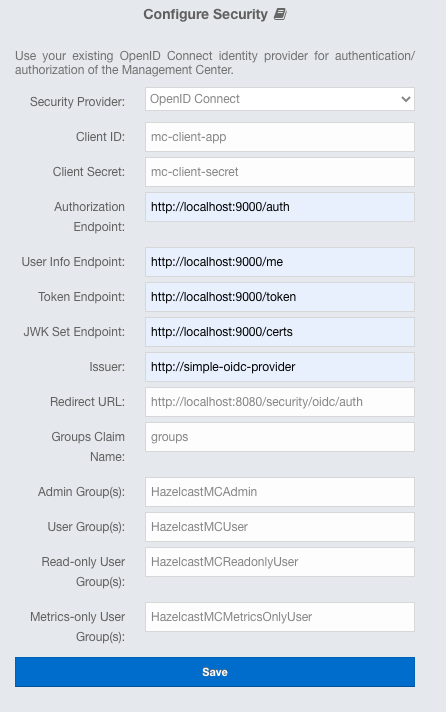
Provide the details in this form for OpenID Connect:
-
Client ID: The OAuth2 client ID that you obtain from your OpenID provider.
-
Client Secret: The OAuth2 client secret that you obtain from your OpenID provider.
-
Authorization Endpoint: Authorization endpoint URL of your OpenID provider.
-
User Info Endpoint: User info endpoint URL of your OpenID provider.
-
Token Endpoint: Token endpoint URL of your OpenID provider.
-
JWK Set Endpoint: JWK set endpoint URL of your OpenID provider.
-
Issuer: Issuer identifier of your OpenID provider.
-
Redirect URL: URL of the Management Center endpoint that handles responses to authentication requests, including schema (
http://orhttps://) and port. It is located under the path/oidc/authso you should append/oidc/authto the Management Center URL. Your OpenID provider should have access to this URL as it will post back responses to authentication requests to this URL. For example, if Management Center and the OpenID provider are on the same machine, you would enter “http://127.0.0.1:8080/oidc/auth”. -
Groups Claim Name: Name of the claim that contains group(s) of the user.
-
Admin Group(s): Members of this group have admin privileges on the Management Center. To use more than one group, separate them with the group name separator you have configured.
-
User Group(s): Members of this group have read and write privileges on the Management Center. To use more than one group, separate them with the group name separator you have configured.
-
Read-only User Group(s): Members of this group have only read privilege on the Management Center. To use more than one group, separate them with the group name separator you have configured.
-
Metrics-only Group(s): Members of this group have the privilege to see only the metrics on the Management Center. To use more than one group, separate them with the group name separator you have configured.
| If the user has more than one authority, Management Center uses the highest one. |
Once you configure OpenID Connect, a button for single sign-on will be shown in the login page. Clicking it will start the OpenID Connect single sign-on process. If you don’t have an existing session with your OpenID provider, you will be taken to the login page of your OpenID provider. Once you log into your OpenID provider, you will be redirected back to Management Center as a logged in user.
7. User Interface Overview
Once the page is loaded after selecting a cluster, Status Page appears as shown below:
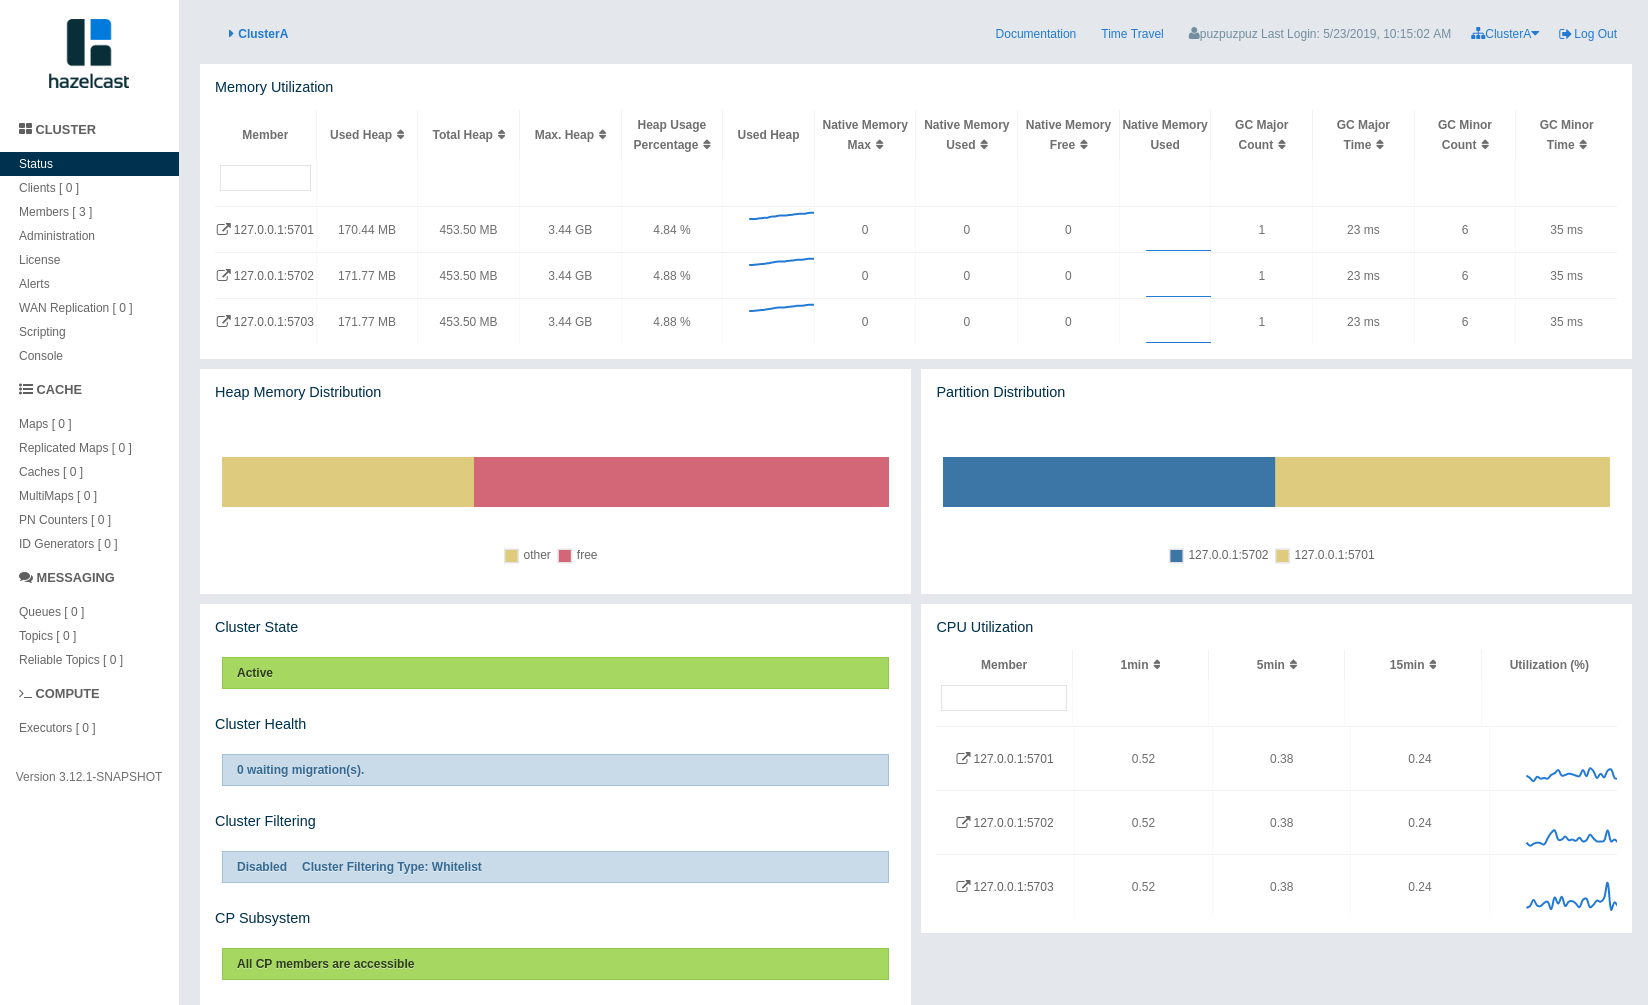
This page provides the fundamental properties of the selected cluster which are explained in the Status Page section. The page has a toolbar on the top and a menu on the left.
7.1. Toolbar

The toolbar has the following elements:
-
Navigation Breadcrumb: The leftmost element is the navigation breadcrumb that you can use to navigate to the previously opened pages. For example, while you’re on the page where you’re viewing a map, you can click on the Maps link to go back to the page where all map instances are listed.
-
Documentation: Opens the Management Center documentation in a new browser tab.
-
Time Travel: Shows the cluster’s situation at a time in the past. See the Time Travel section.
-
User name and last login time: The current user’s name and last login time is shown for security purposes.
-
Cluster Selector: Switches between the clusters. When clicked on, a dropdown list of clusters appears.

The user can select any cluster and once selected, the page immediately loads with the selected cluster’s information.
-
Logout: Closes the current user’s session.
7.2. Menu
The Home Page includes a menu on the left which lists the distributed data structures in the cluster, cluster members and clients connected to the cluster (numbers in square brackets show the instance count for each entity), as shown below. You can also see an overview state of your cluster, create alerts, execute codes and perform user/license operations using this menu:
| Distributed data structures are shown when the proxies are created for them. |
| WAN Replication button is only visible with the Hazelcast IMDG Enterprise license. |
The following is the list of menu items with links to their explanations:
8. Status Page
This is the first page appearing after logging in. It gives an overview of the connected cluster. The following subsections describe each portion of the page.
8.1. Memory Utilization
This part of the page provides information related to the memory usages for each member, as shown below:
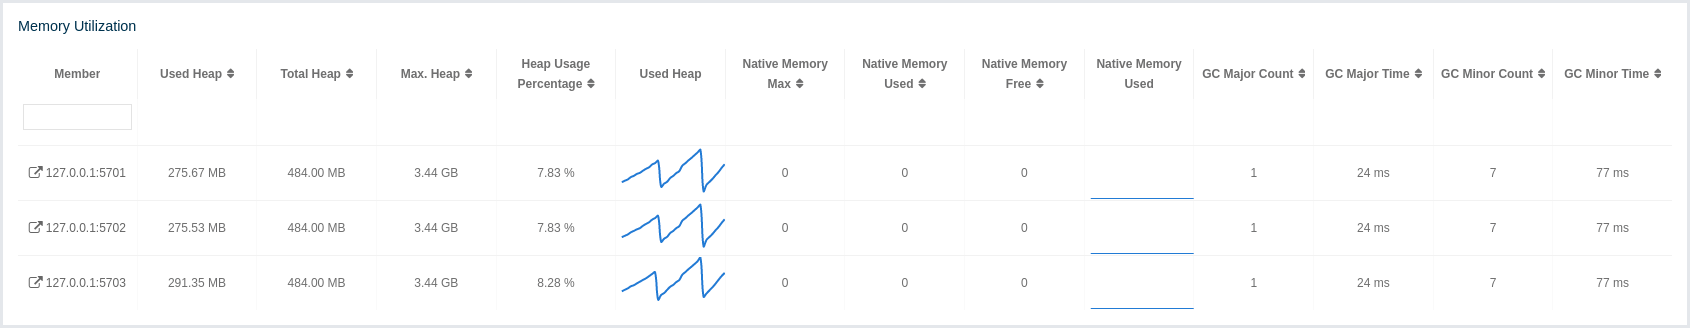
The first column lists the members with their IPs and ports. The next columns show the used and free memories out of the total memory reserved for Hazelcast IMDG usage, in real-time. The Max. Heap column lists the maximum memory capacity of each member and the Heap Usage Percentage column lists the percentage value of used memory out of the maximum memory. The Used Heap column shows the memory usage of members graphically. When you move the mouse cursor on a desired graph, you can see the memory usage at the time where the cursor is placed. Graphs under this column show the memory usages approximately for the last 2 minutes.
8.2. Heap Memory Distribution
This part of the page graphically provides the cluster wise breakdown of heap memory, as shown below. The blue area is the heap memory used by the maps (including all owned/backup entries, any near cache usage and cost of the Merkle tree). The dark yellow area is the heap memory used by both non-Hazelcast entities and all Hazelcast entities except the map, i.e., the heap memory used by all entities subtracted by the heap memory used by map. The green area is the free heap memory out of the whole cluster’s total committed heap memory.
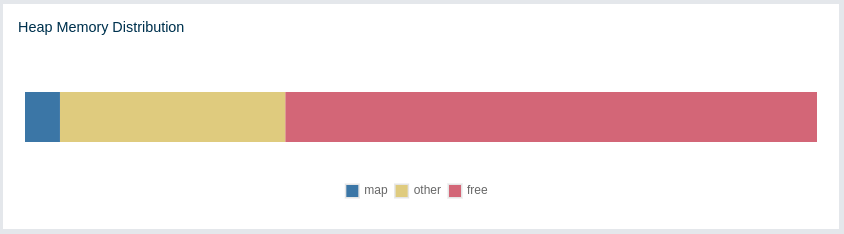
In the above example, you can see about 3% of the total heap memory is used by Hazelcast IMDG maps, about 30% is used by both non-Hazelcast entities and all Hazelcast entities except the map and the rest of the total heap memory is free. You can see the exact percentages by placing the mouse cursor on the chart.
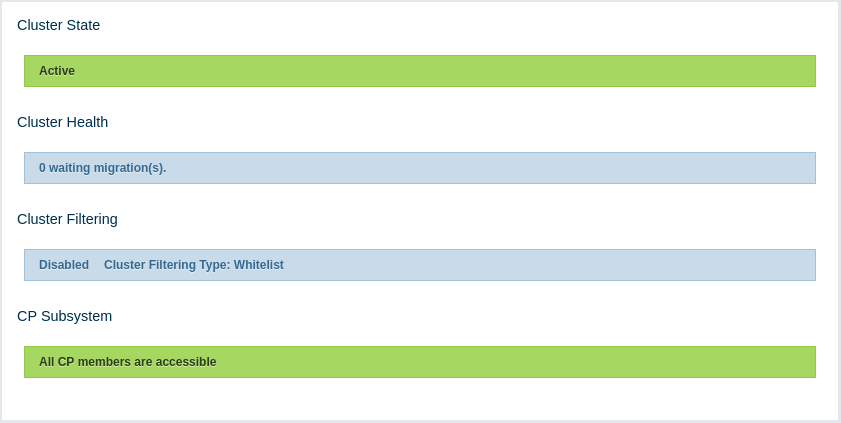
8.3. Cluster State/Health/Client Filtering/CP Subsystem
This part has the following status indicator elements:
-
Cluster State: Shows the current cluster state. For more information on cluster states, see the Cluster State section.
-
Cluster Health: Shows how many migrations are taking place currently.
-
Client Filtering: Shows values for the current cluster client filtering status and type. For more information on the cluster client filtering, see the Changing Cluster Client Filtering section.
-
CP Subsystem: Shows the CP subsystem status. For more information on the CP subsystem support in the Management Center, see the CP Subsystem section.
| Cluster client filtering is only available with Hazelcast IMDG license that includes the Cluster Client Filtering feature. |
8.4. Partition Distribution
This chart shows what percentage of partitions each cluster member has, as shown below:
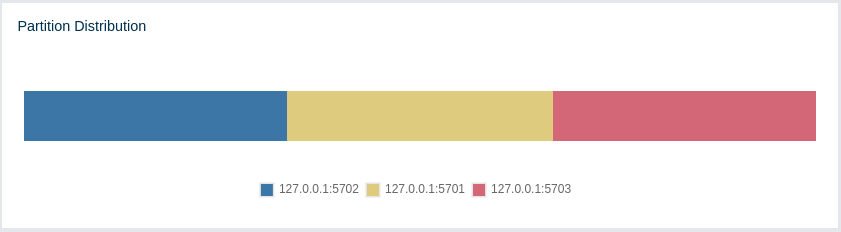
You can see each member’s partition percentages by placing the mouse cursor on the
chart. In the above example, you can see that each member has about 33.3% of
the total partition count (which is 271 by default and configurable; see the hazelcast.partition.count
property explained in the
System Properties section in
the Hazelcast IMDG Reference Manual).
The partition distribution chart does not show any information
until you create your distributed objects. When you add new members to your cluster,
there will be no partition migration since partitions do not exist yet. Once you connect
to your cluster and, for example, create a map (using hazelcastInstance.getMap()),
only then this chart starts to show partition distribution information.
|
8.5. CPU Utilization
This part of the page provides load and utilization information for the CPUs for each cluster member, as shown below:
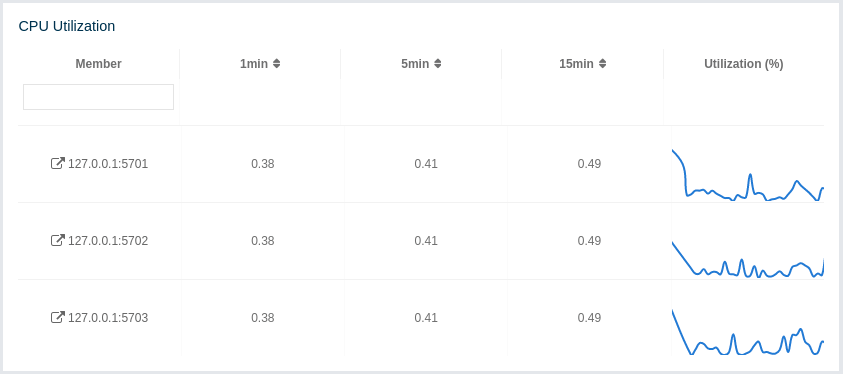
The first column lists the members with their IPs and ports. The next columns list the system load averages on each member for the last 1, 5 and 15 minutes. These average values are calculated as the sum of the count of runnable entities running on and queued to the available CPUs averaged over the last 1, 5 and 15 minutes. This calculation is operating system specific, typically a damped time-dependent average. If system load average is not available, these columns show negative values.
The last column (Utilization(%)) graphically shows the recent load on the CPUs. When you move the mouse cursor on a chart, you can see the CPU load at the time where the cursor is placed. The charts under this column shows the CPU loads approximately for the last 2 minutes. If recent CPU load is not available, you will see N/A values.
9. Monitoring Members
Use this menu item to monitor each cluster member and perform operations like running garbage collection (GC) and taking a thread dump.
You can see a list of all the members in your cluster by clicking on the Members menu item on the left panel. A new page is opened on the right, as shown below.
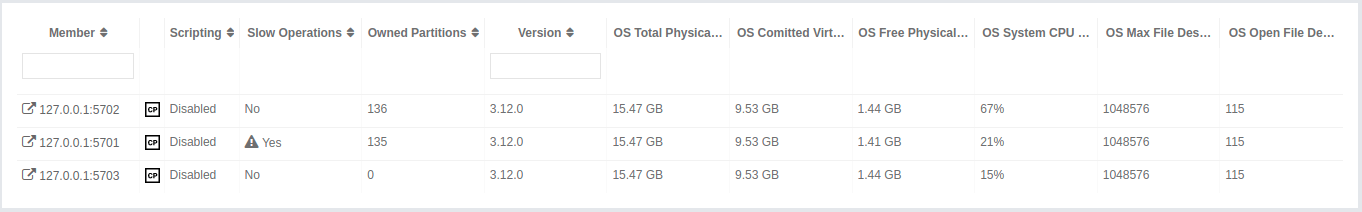
| You may see a warning icon with exclamation mark in the list when your runtime or hardware configuration does not follow the performance recommendations. See IMDG Deployment and Operations Guide for more information. |
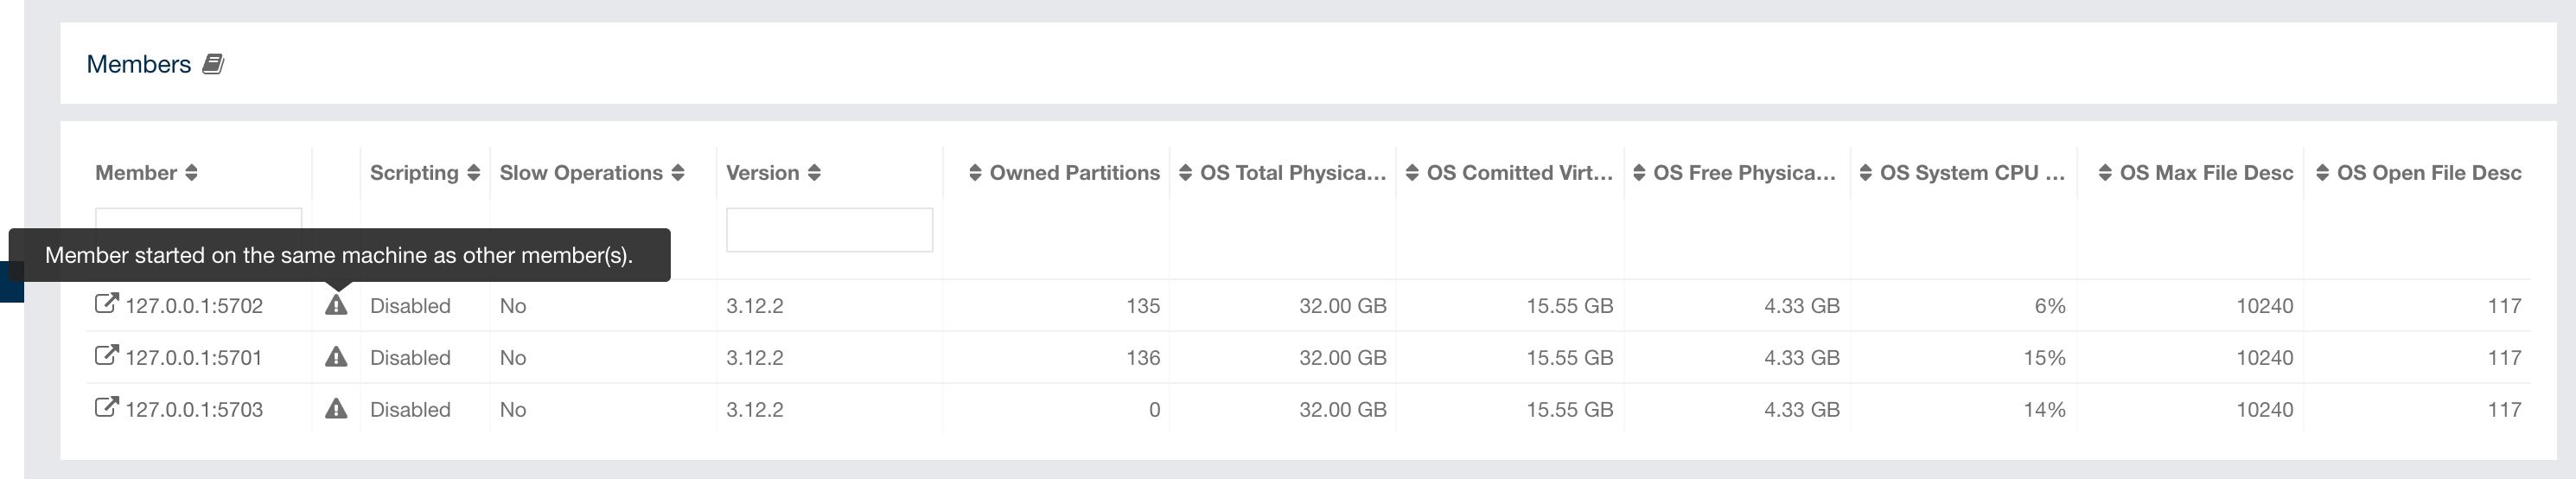
You can filter the members shown and you can also sort the table by clicking on the column headers. Members that participate in the CP subsystem are marked with the CP icon. Clicking on a member name opens a new page for monitoring that member on the right, as shown below.
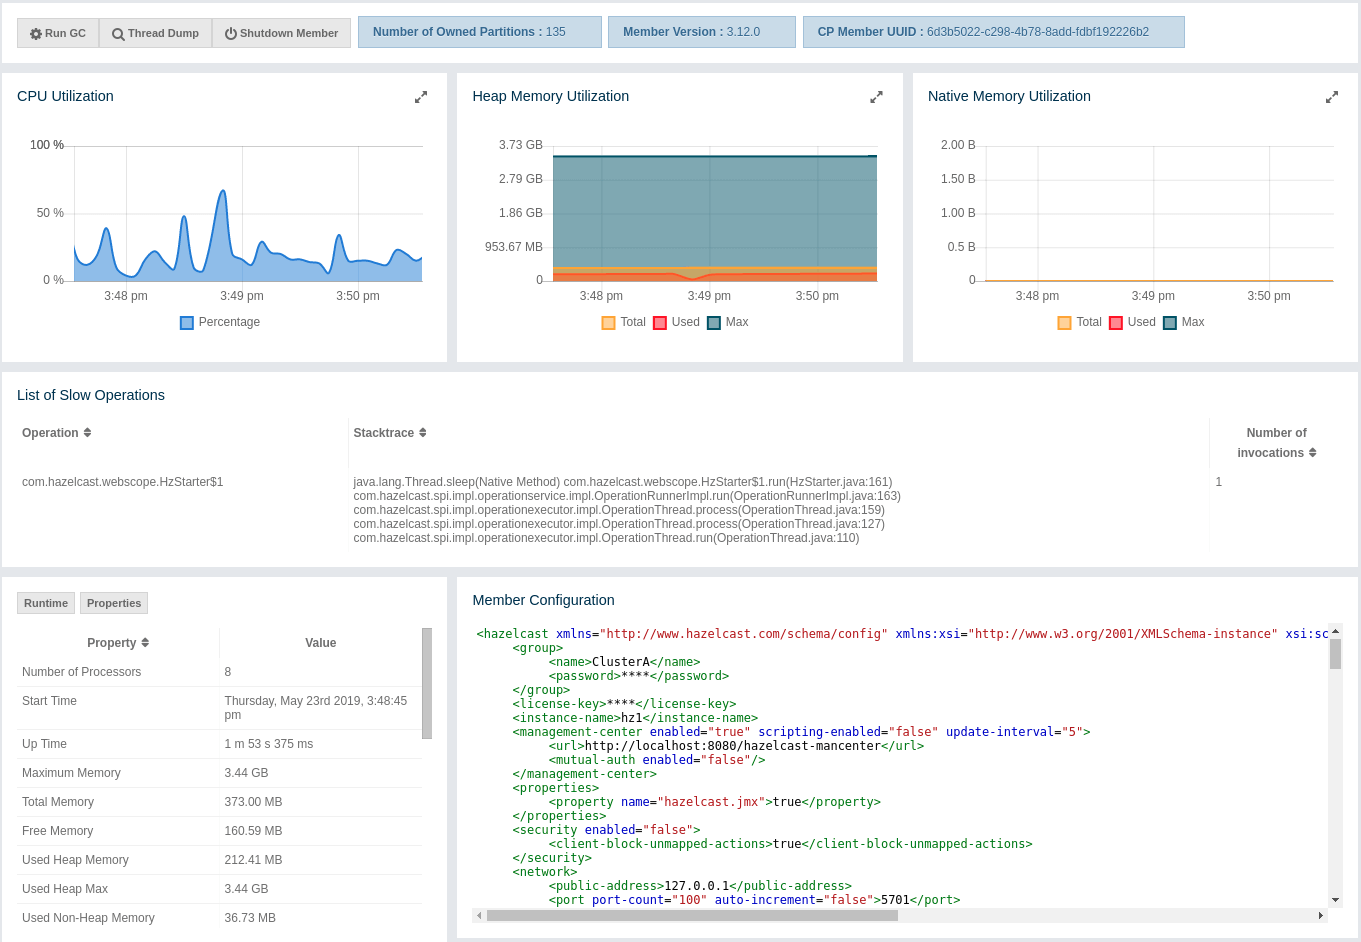
You can perform the following operations on the selected member using the buttons located at the top left of the page:
-
Run GC: Executes garbage collection on the selected member. A notification stating that the GC execution was successful is shown.
-
Thread Dump: Takes a thread dump of the selected member and shows it in a separate dialog.
-
Shutdown Member: Shuts down the selected member.
-
Promote Member: It is only shown for the lite members. When pressed, the lite member becomes a data member.
| Shutdown member operation requires enabled REST API in the IMDG cluster. See the IMDG documentation for more information. |
Next to the above operation buttons, you can see the informative buttons as described below:
-
Number of Owned Partitions: Shows how many partitions are assigned to the selected member.
-
Member Version: Shows the Hazelcast IMDG cluster version which the selected member belongs to.
-
CP Member UUID: Shows CP member UUID if the member participates in the CP subsystem of the cluster.
The CPU Utilization chart shows the percentage
of CPU usage on the selected member. The Heap/Memory
Utilization charts show the memory usage on the
selected member with three different metrics
(maximum, used and total memory). You can open
each chart as a separate dialog using
the  button
placed at top right of them; this gives you
a clearer view of the chart.
button
placed at top right of them; this gives you
a clearer view of the chart.
Runtime is a dynamically updated window tab showing the processor number, the start and up times, and the maximum, total and free memory sizes of the selected member. These values are collected from the default MXBeans provided by the Java Virtual Machine (JVM). Descriptions from the Javadocs and some explanations are below:
-
Number of Processors: Number of processors available to the member (JVM).
-
Start Time: Start time of the member (JVM) in milliseconds.
-
Up Time: Uptime of the member (JVM) in milliseconds
-
Maximum Memory: Maximum amount of memory that the member (JVM) will attempt to use.
-
Free Memory: Amount of free memory in the member (JVM).
-
Used Heap Memory: Amount of used memory in bytes.
-
Max Heap Memory: Maximum amount of memory in bytes that can be used for memory management.
-
Used Non-Heap Memory: Amount of used memory in bytes.
-
Max Non-Heap Memory: Maximum amount of memory in bytes that can be used for memory management.
-
Total Loaded Classes: Total number of classes that have been loaded since the member (JVM) has started execution.
-
Current Loaded Classes: Number of classes that are currently loaded in the member (JVM).
-
Total Unloaded Classes: Total number of classes unloaded since the member (JVM) has started execution.
-
Total Thread Count: Total number of threads created and also started since the member (JVM) started.
-
Active Thread Count: Current number of live threads including both daemon and non-daemon threads.
-
Peak Thread Count: Peak live thread count since the member (JVM) started or peak was reset.
-
Daemon Thread Count: Current number of live daemon threads.
-
OS: Free Physical Memory: Amount of free physical memory in bytes.
-
OS: Committed Virtual Memory: Amount of virtual memory that is guaranteed to be available to the running process in bytes.
-
OS: Total Physical Memory: Total amount of physical memory in bytes.
-
OS: Free Swap Space: Amount of free swap space in bytes. Swap space is used when the amount of physical memory (RAM) is full. If the system needs more memory resources and the RAM is full, inactive pages in memory are moved to the swap space.
-
OS: Total Swap Space: Total amount of swap space in bytes.
-
OS: Maximum File Descriptor Count: Maximum number of file descriptors. File descriptor is an integer number that uniquely represents an opened file in the operating system.
-
OS: Open File Descriptor Count: Number of open file descriptors.
-
OS: Process CPU Time: CPU time used by the process on which the member (JVM) is running in nanoseconds.
-
OS: Process CPU Load: Recent CPU usage for the member (JVM) process. This is a double with a value from 0.0 to 1.0. A value of 0.0 means that none of the CPUs were running threads from the member (JVM) process during the recent period of time observed, while a value of 1.0 means that all CPUs were actively running threads from the member (JVM) 100% of the time during the recent period being observed. Threads from the member (JVM) include the application threads as well as the member (JVM) internal threads.
-
OS: System Load Average: System load average for the last minute. The system load average is the average over a period of time of this sum: (the number of runnable entities queued to the available processors) + (the number of runnable entities running on the available processors). The way in which the load average is calculated is operating system specific but it is typically a damped time-dependent average.
-
OS: System CPU Load: Recent CPU usage for the whole system represented as a percentage value.
0%means that all CPUs were idle during the recent period of time observed, while100%means that all CPUs were actively running during the recent period being observed.
| These descriptions may vary according to the JVM version or vendor. |
The Member Configuration window shows the XML configuration of the connected Hazelcast cluster.
The List of Slow Operations gives an overview of detected slow operations which occurred on that member. The data is collected by the SlowOperationDetector.

Click on an entry to open a dialog which shows the stacktrace and detailed information about each slow invocation of this operation.
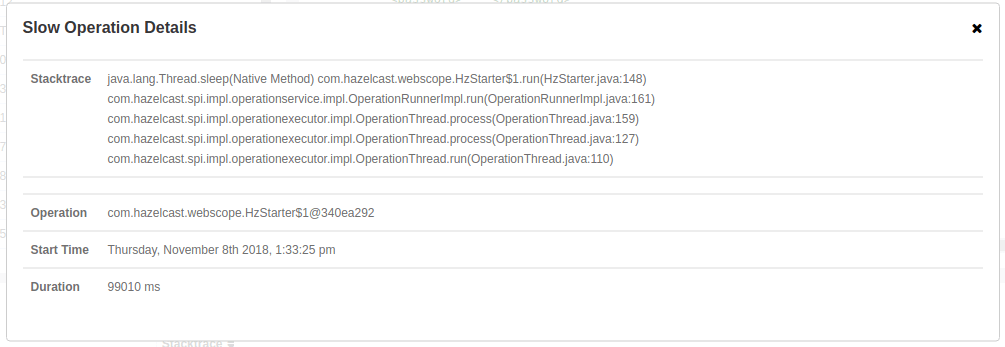
10. Monitoring Clients
You can use the Clients menu item to monitor all the clients that are connected to your Hazelcast cluster.
Only basic information for clients, like client instance
name, address, type and labels, is shown by default. The
values for
other fields are shown as N/A. As a prerequisite for
seeing the full information, you need to enable the client
statistics before starting your clients. This can be done
by setting the hazelcast.client.statistics.enabled system
property to true on the client. Please see the
Client System Properties section
in the Hazelcast IMDG Reference Manual for more information.
After you enable the client statistics, you can monitor your
clients using Hazelcast Management Center.
You can see a list of all the clients in your cluster by clicking on the Clients menu item on the left panel. A new page is opened on the right, as shown below. The page has two tabs: Connection and Filter. The Connection tab is opened by default. This tab shows the list of all the clients. See the Changing Cluster Client Filtering section for the Filter tab’s description.
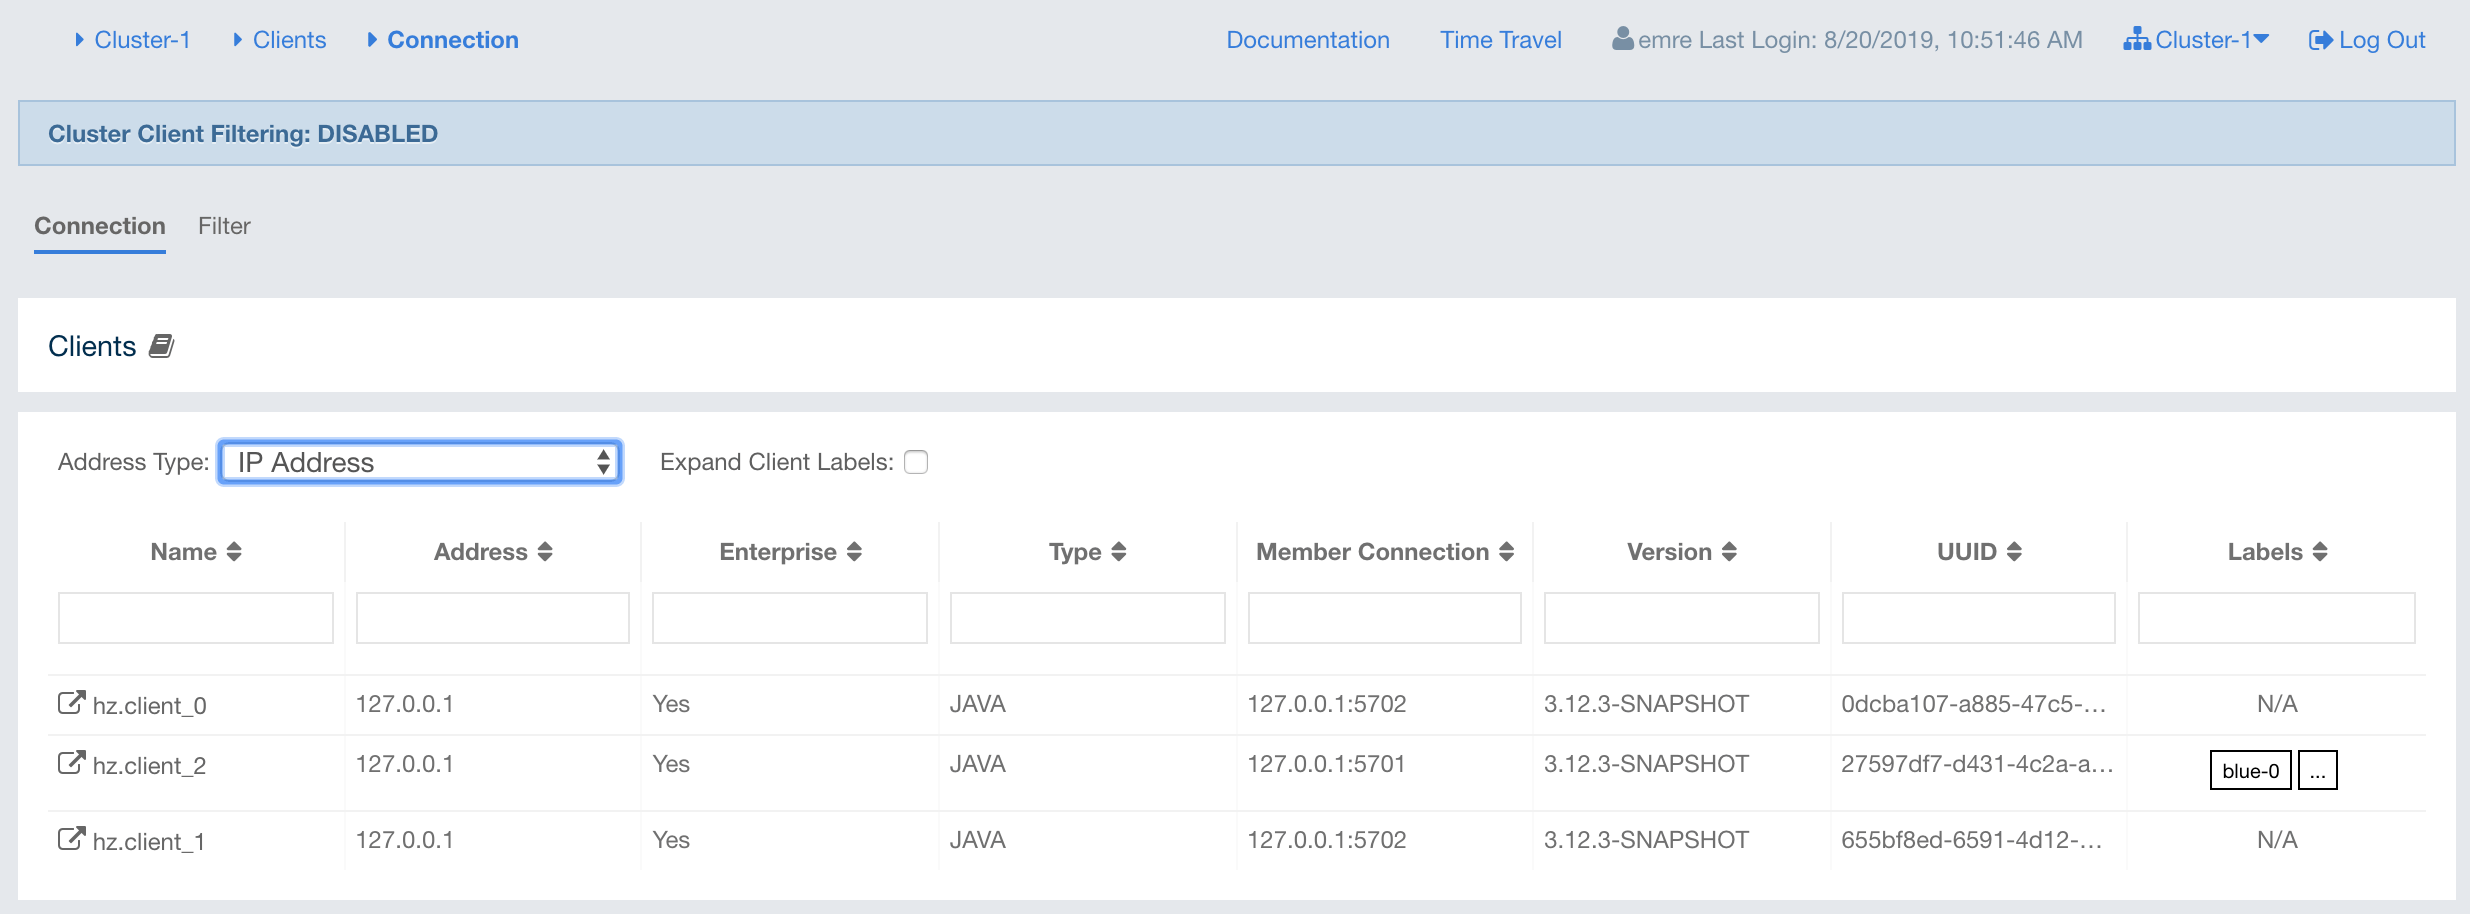
By default, hostname of the client is shown in the address column. You can change it to show its IP address or its canonical hostname instead by using the Address Type combo box. Note that this will also cause the client details page to show the IP address or the canonical hostname.
Your IMDG member’s version needs to be 3.12.3 or
newer to be able to see the IP address or the canonical hostname.
For older versions, this information is not available and N/A
is shown instead. Client version is not important and can be an
older version.
|
You can filter the clients shown and you can also sort the table by clicking on the column headers. Clicking on a client name will open a new page for monitoring that client on the right, as shown below.
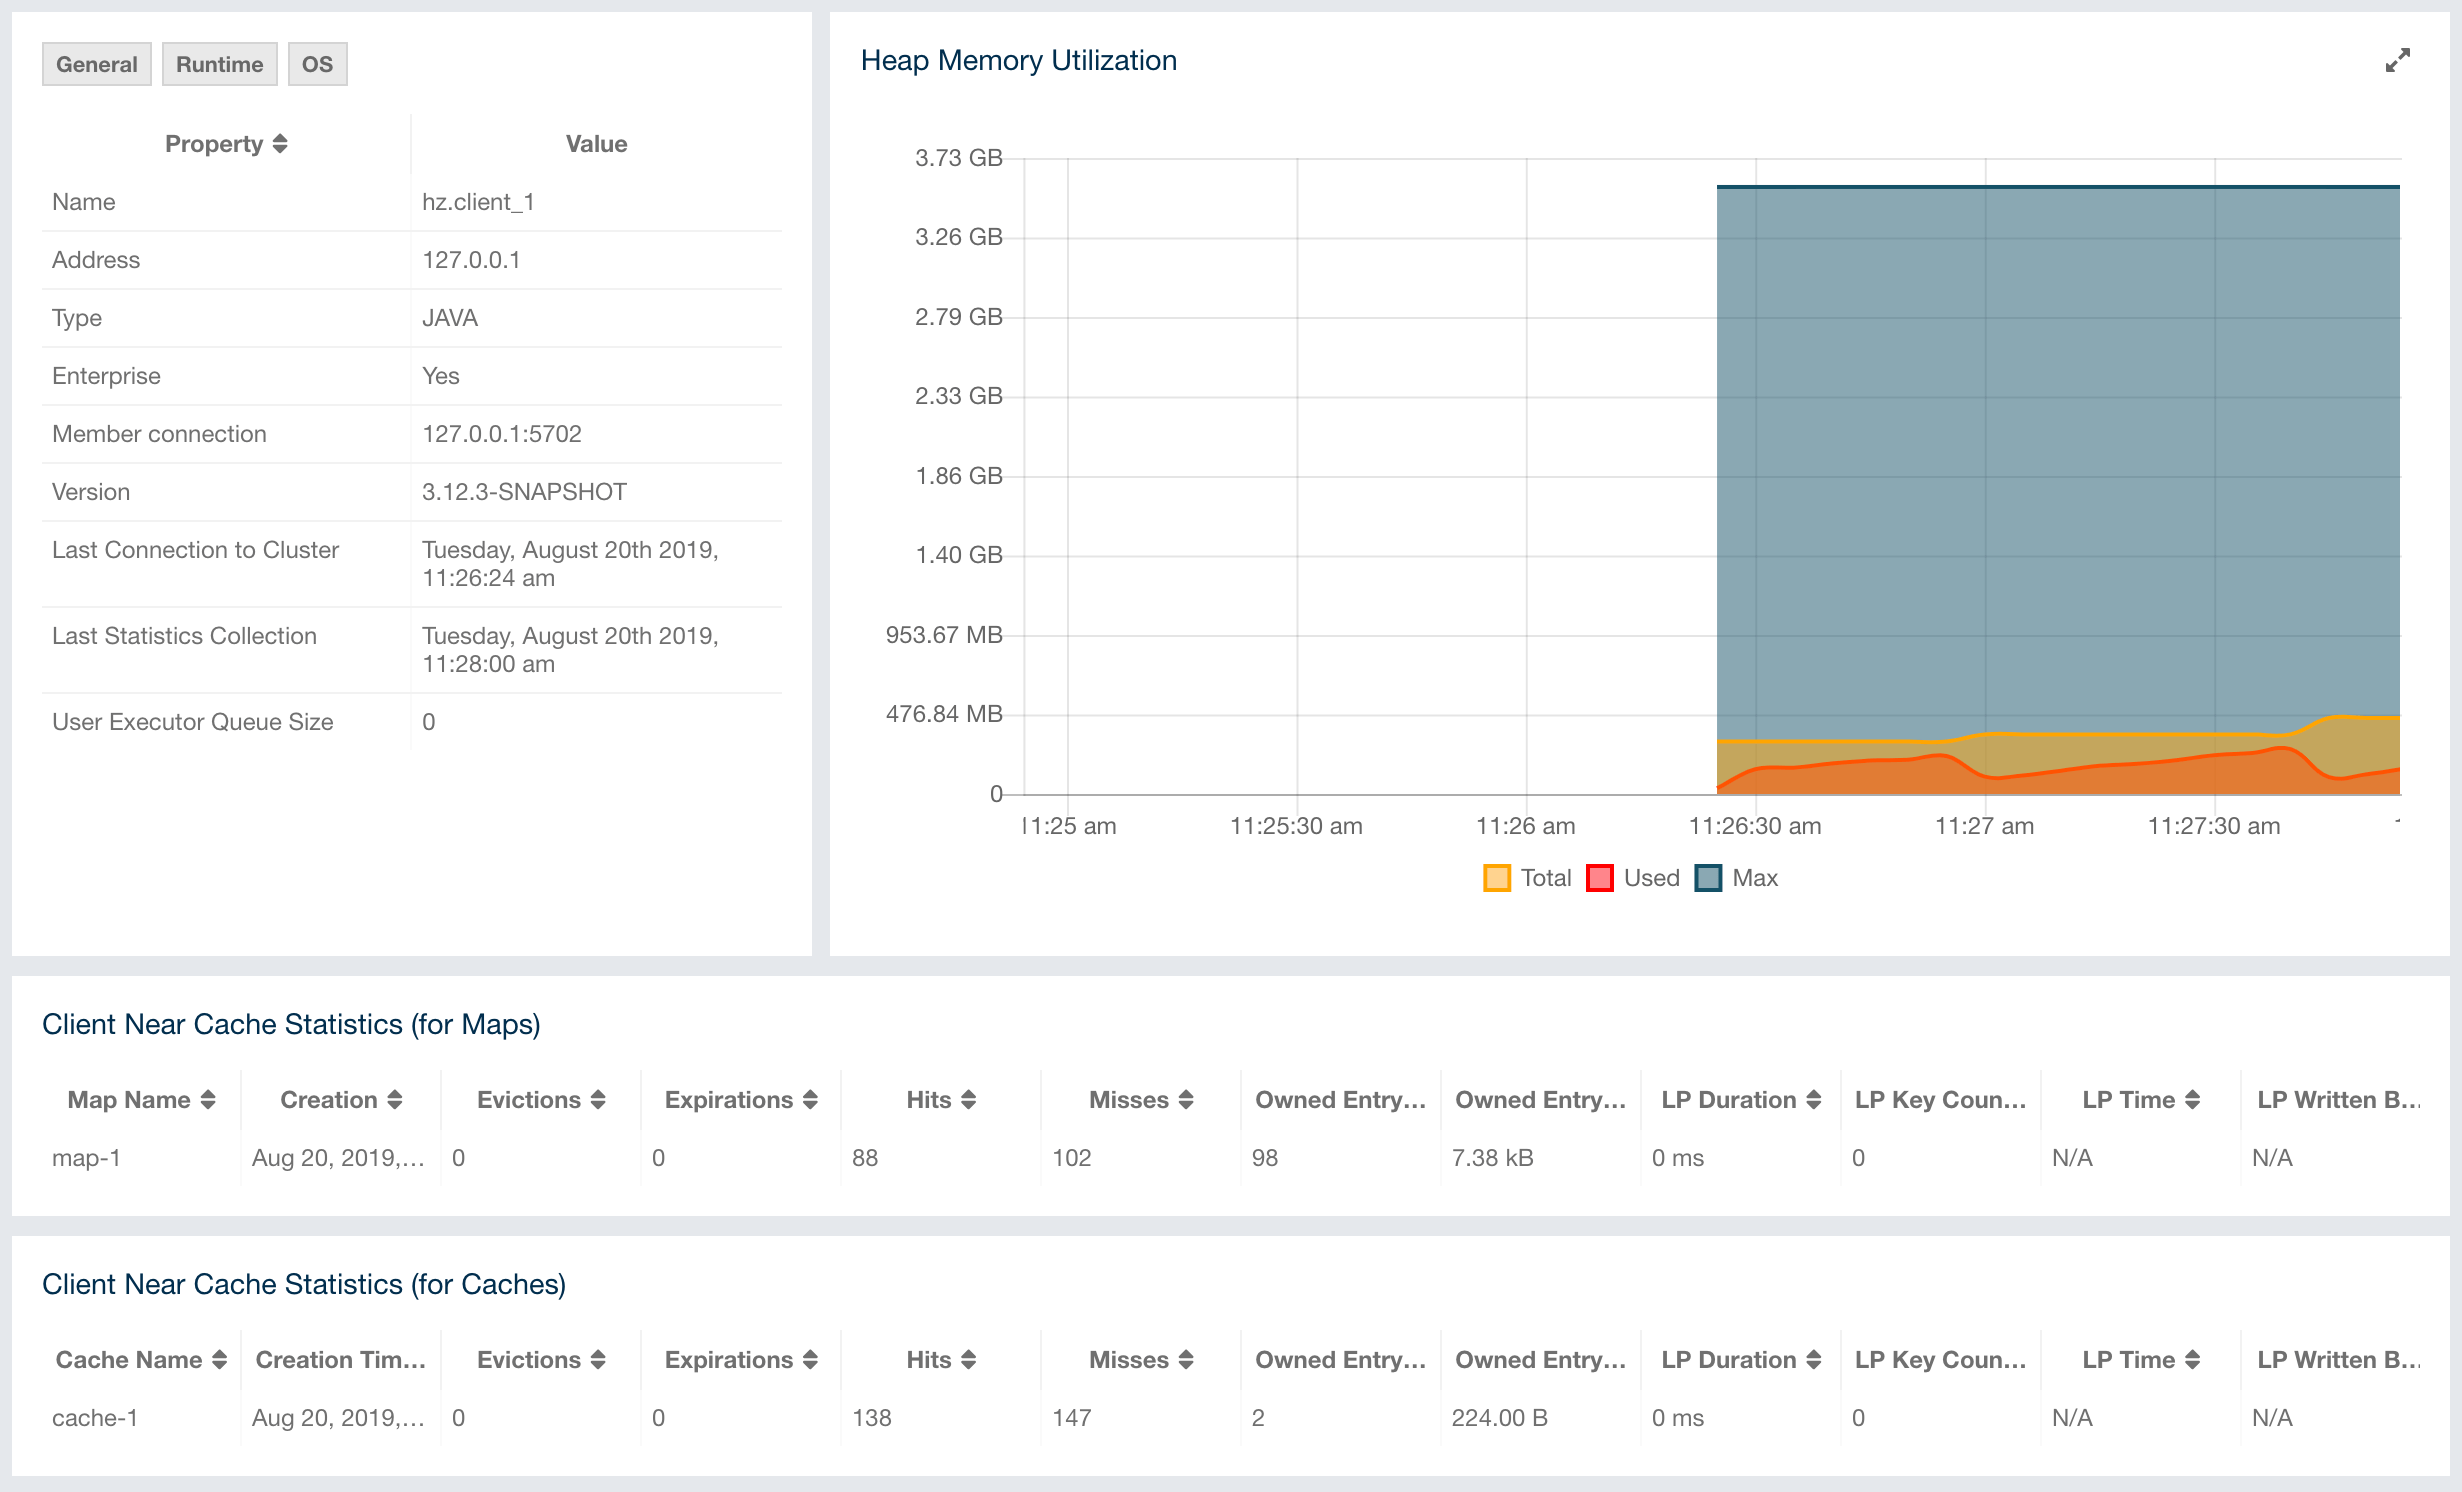
The Heap Memory Utilization chart shows the memory usage
on the selected client with three different metrics
(maximum, used and total memory) represented by different colors. You can open this
chart as a separate window using the
button placed at top right of it; this gives you a
clearer view of the chart.
General is a dynamically updated window tab showing general information about the client. Below are brief explanations for each piece of information:
-
Name: Name of the client instance.
-
Address: Local IP address of the client that is used for connecting to members.
-
Type: Type of the client.
-
Enterprise: Yes, if the client is an Hazelcast IMDG Enterprise client.
-
Member Connection: Shows to which member a client is currently connected to. Please note that ALL means a client is configured so that it might connect to all members of a cluster, i.e., it might not have a connection to all members all the time.
-
Version: Version of the client.
-
Last Connection to Cluster: Time that the client connected to the cluster. It is reset on each reconnection.
-
Last Statistics Collection: Time when the latest update for the statistics is collected from the client.
-
User Executor Queue Size: Number of waiting tasks in the client user executor.
-
Labels: List of client labels.
Next to the General tab, the Runtime tab shows the processor number, uptime, and maximum, total and free memory sizes of the selected client. These values are collected from the default MXBeans provided by the Java Virtual Machine (JVM). Descriptions from the Javadocs and some explanations are below:
-
Number of Processors: Number of processors available to the client (JVM).
-
Up Time: Uptime of the client (JVM).
-
Maximum Memory: Maximum amount of memory that the client (JVM) will attempt to use.
-
Total Memory: Amount of total heap memory currently available for current and future objects in the client (JVM).
-
Free Memory: Amount of free heap memory in the client (JVM).
-
Used Memory: Amount of used heap memory in the client (JVM).
Next to the Runtime tab, the OS tab shows statistics about the operating system of the client. These values are collected from the default MXBeans provided by the Java Virtual Machine (JVM). Descriptions from the Javadocs and some explanations are below:
-
Free Physical Memory: Amount of free physical memory.
-
Committed Virtual Memory: Amount of virtual memory that is guaranteed to be available to the running process.
-
Total Physical Memory: Total amount of physical memory.
-
Free Swap Space: Amount of free swap space. Swap space is used when the amount of physical memory (RAM) is full. If the system needs more memory resources and the RAM is full, inactive pages in memory are moved to the swap space.
-
Total Swap Space: Total amount of swap space.
-
Maximum File Descriptor Count: Maximum number of file descriptors. File descriptor is an integer number that uniquely represents an opened file in the operating system.
-
Open File Descriptor Count: Number of open file descriptors.
-
Process CPU Time: CPU time used by the process on which the member (JVM) is running.
-
System Load Average: System load average for the last minute. The system load average is the average over a period of time of this sum: (the number of runnable entities queued to the available processors) + (the number of runnable entities running on the available processors). The way in which the load average is calculated is operating system specific but it is typically a damped time-dependent average.
| Some of the Runtime/OS statistics may not be available for your client’s JVM implementation/operating system. N/A is shown for these types of statistics. Please refer to your JVM/operating system documentation for further details. |
The Client Near Cache Statistics table shows statistics related to the Near Cache of a client. There are two separate tables; one for maps and one for caches.
-
Map/Cache Name: Name of the map or cache.
-
Creation Time: Creation time of this Near Cache on the client.
-
Evictions: Number of evictions of Near Cache entries owned by the client.
-
Expirations: Number of TTL and max-idle expirations of Near Cache entries owned by the client.
-
Hits: Number of hits (reads) of Near Cache entries owned by the client.
-
Misses: Number of misses of Near Cache entries owned by the client.
-
Owned Entry Count: Number of Near Cache entries owned by the client.
-
Owned Entry Memory Cost: Memory cost of Near Cache entries owned by the client.
-
LP Duration: Duration of the last Near Cache key persistence (when the pre-load feature is enabled).
-
LP Key Count: Number of Near Cache key persistences (when the pre-load feature is enabled).
-
LP Time: Time of the last Near Cache key persistence (when the pre-load feature is enabled).
-
LP Written Bytes: Written number of bytes of the last Near Cache key persistence (when the pre-load feature is enabled).
-
LP Failure: Failure reason of the last Near Cache persistence (when the pre-load feature is enabled).
Please note that you can configure the time interval for which
the client statistics are collected and sent to the cluster,
using the system property hazelcast.client.statistics.period.seconds.
See the
System Properties section
in the Hazelcast IMDG Reference Manual for more information.
|
10.1. Changing Cluster Client Filtering
| The Filter tab is only available with Hazelcast IMDG license that includes the Cluster Client Filtering feature. |
The Filter tab includes Cluster Client Filtering status, Cluster Client Filter Settings and Client Filtering Lists sections, as shown below.
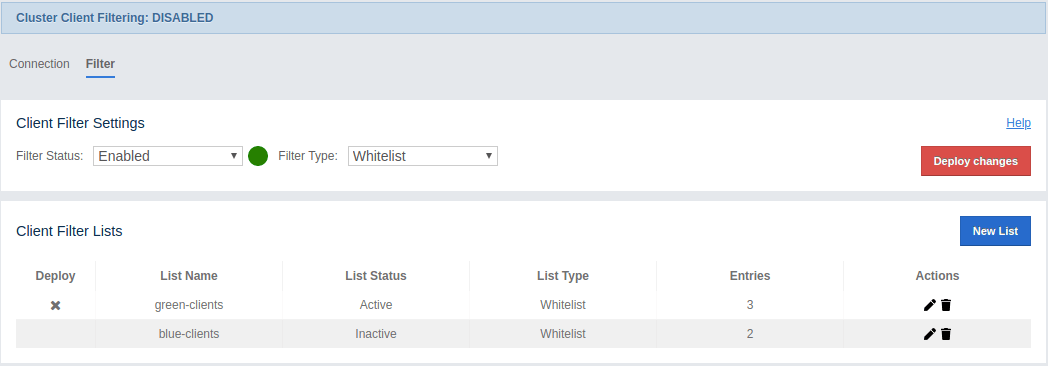
The Cluster Client Filtering status section describes if there is a deployed client filtering list available to all cluster members (Enabled status), or if the feature is disabled for the cluster and the members allow any clients (Disabled status).
The Cluster Client Filter Settings section allows to specify the status of the feature and the filtering type and to deploy any modifications made in client filtering lists to the deployed list available to all cluster members. On the deploy action the following happens:
-
If the status to be deployed is Disabled, the deployed client filtering list available to all cluster members is cleaned up and the members start allowing any client to connect.
-
If the status to be deployed is Enabled, all entries of the matching lists from the Client Filtering Lists section are copied into the deployed client filtering list and made available for all cluster members. Matching lists are selected by their status (List Status must be Active) and type (List Type must match the value of the Client Filter Type selection).
Once a cluster member receives the deployed client filtering list from the Management Center, it immediately applies the list to all currently connected clients and then uses it for newly connecting clients. Blacklisted clients may connect to another cluster if they are configured to support blue-green deployment. Please see the Blue-Green Deployment and Disaster Recovery section in the Hazelcast IMDG Reference Manual for more information.
| If the Management Center is not accessible by some of the cluster members, those members allow any clients to connect. |
The deploy action in the Cluster Client Filter Settings section is available by clicking on the Deployed/Deploy Changes button. This button also describes if there were any changes in client filtering lists that would lead to changes in the deployed client filtering list as the result of the deploy (Deploy Changes label), or there were no such changes (Deployed label).
The Client Filtering Lists section allows creation, editing and deletion of the client filtering lists. To create a new client filtering list, you need to click the Add New List button, which will open the Create List form, as shown below. Once you enter all fields and entries for the new list, click the Save button to save your modifications.
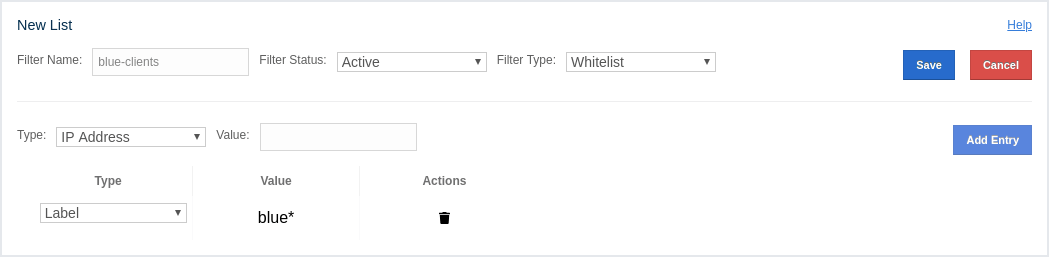
The following formats of list entry values are supported:
-
For the IP Address entry type you can specify IP address (IPv4 or IPv6) with optional range characters (
*and-) instead of any byte group. For instance,10.3.10.*refers to IPs between10.3.10.0and10.3.10.255. The10.3.10.4-18refers to IPs between10.3.10.4and10.3.10.18(4 and 18 included). -
For the Label entry type you can specify any string with optional wildcard characters (
*). For instance,green*refers to any label values that start with thegreenstring. -
For the Instance Name entry type you can specify any string with optional wildcard characters (
*). For instance,*-clientrefers to any label values that end with the-clientstring.
To modify an existing client filtering list, you need to click the Edit button, which will open the Edit List form, as shown below.
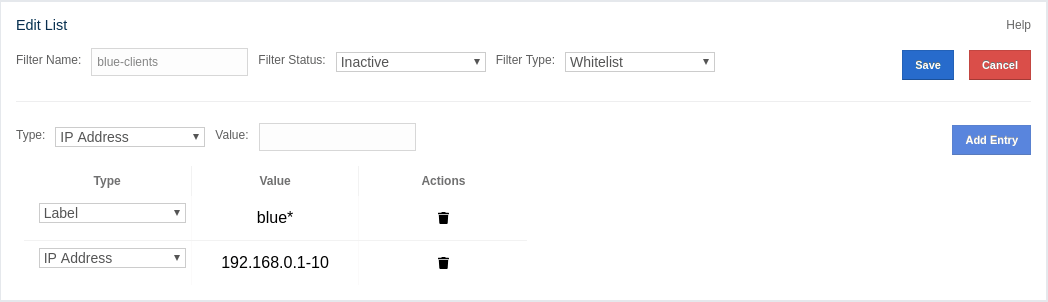
To delete an existing client filtering list, you need to click the Delete button and confirm your action in the opened dialog.
| Any modifications made in the Client Filtering Lists section will become available to members only after the deploy action. |
11. Monitoring Data Structures
This chapter provides information on how you can monitor the Hazelcast data structures in your cluster.
11.1. Maps
You can see a list of all the maps in your cluster by clicking on the Maps menu item on the left panel. A new page is opened on the right, as shown below.
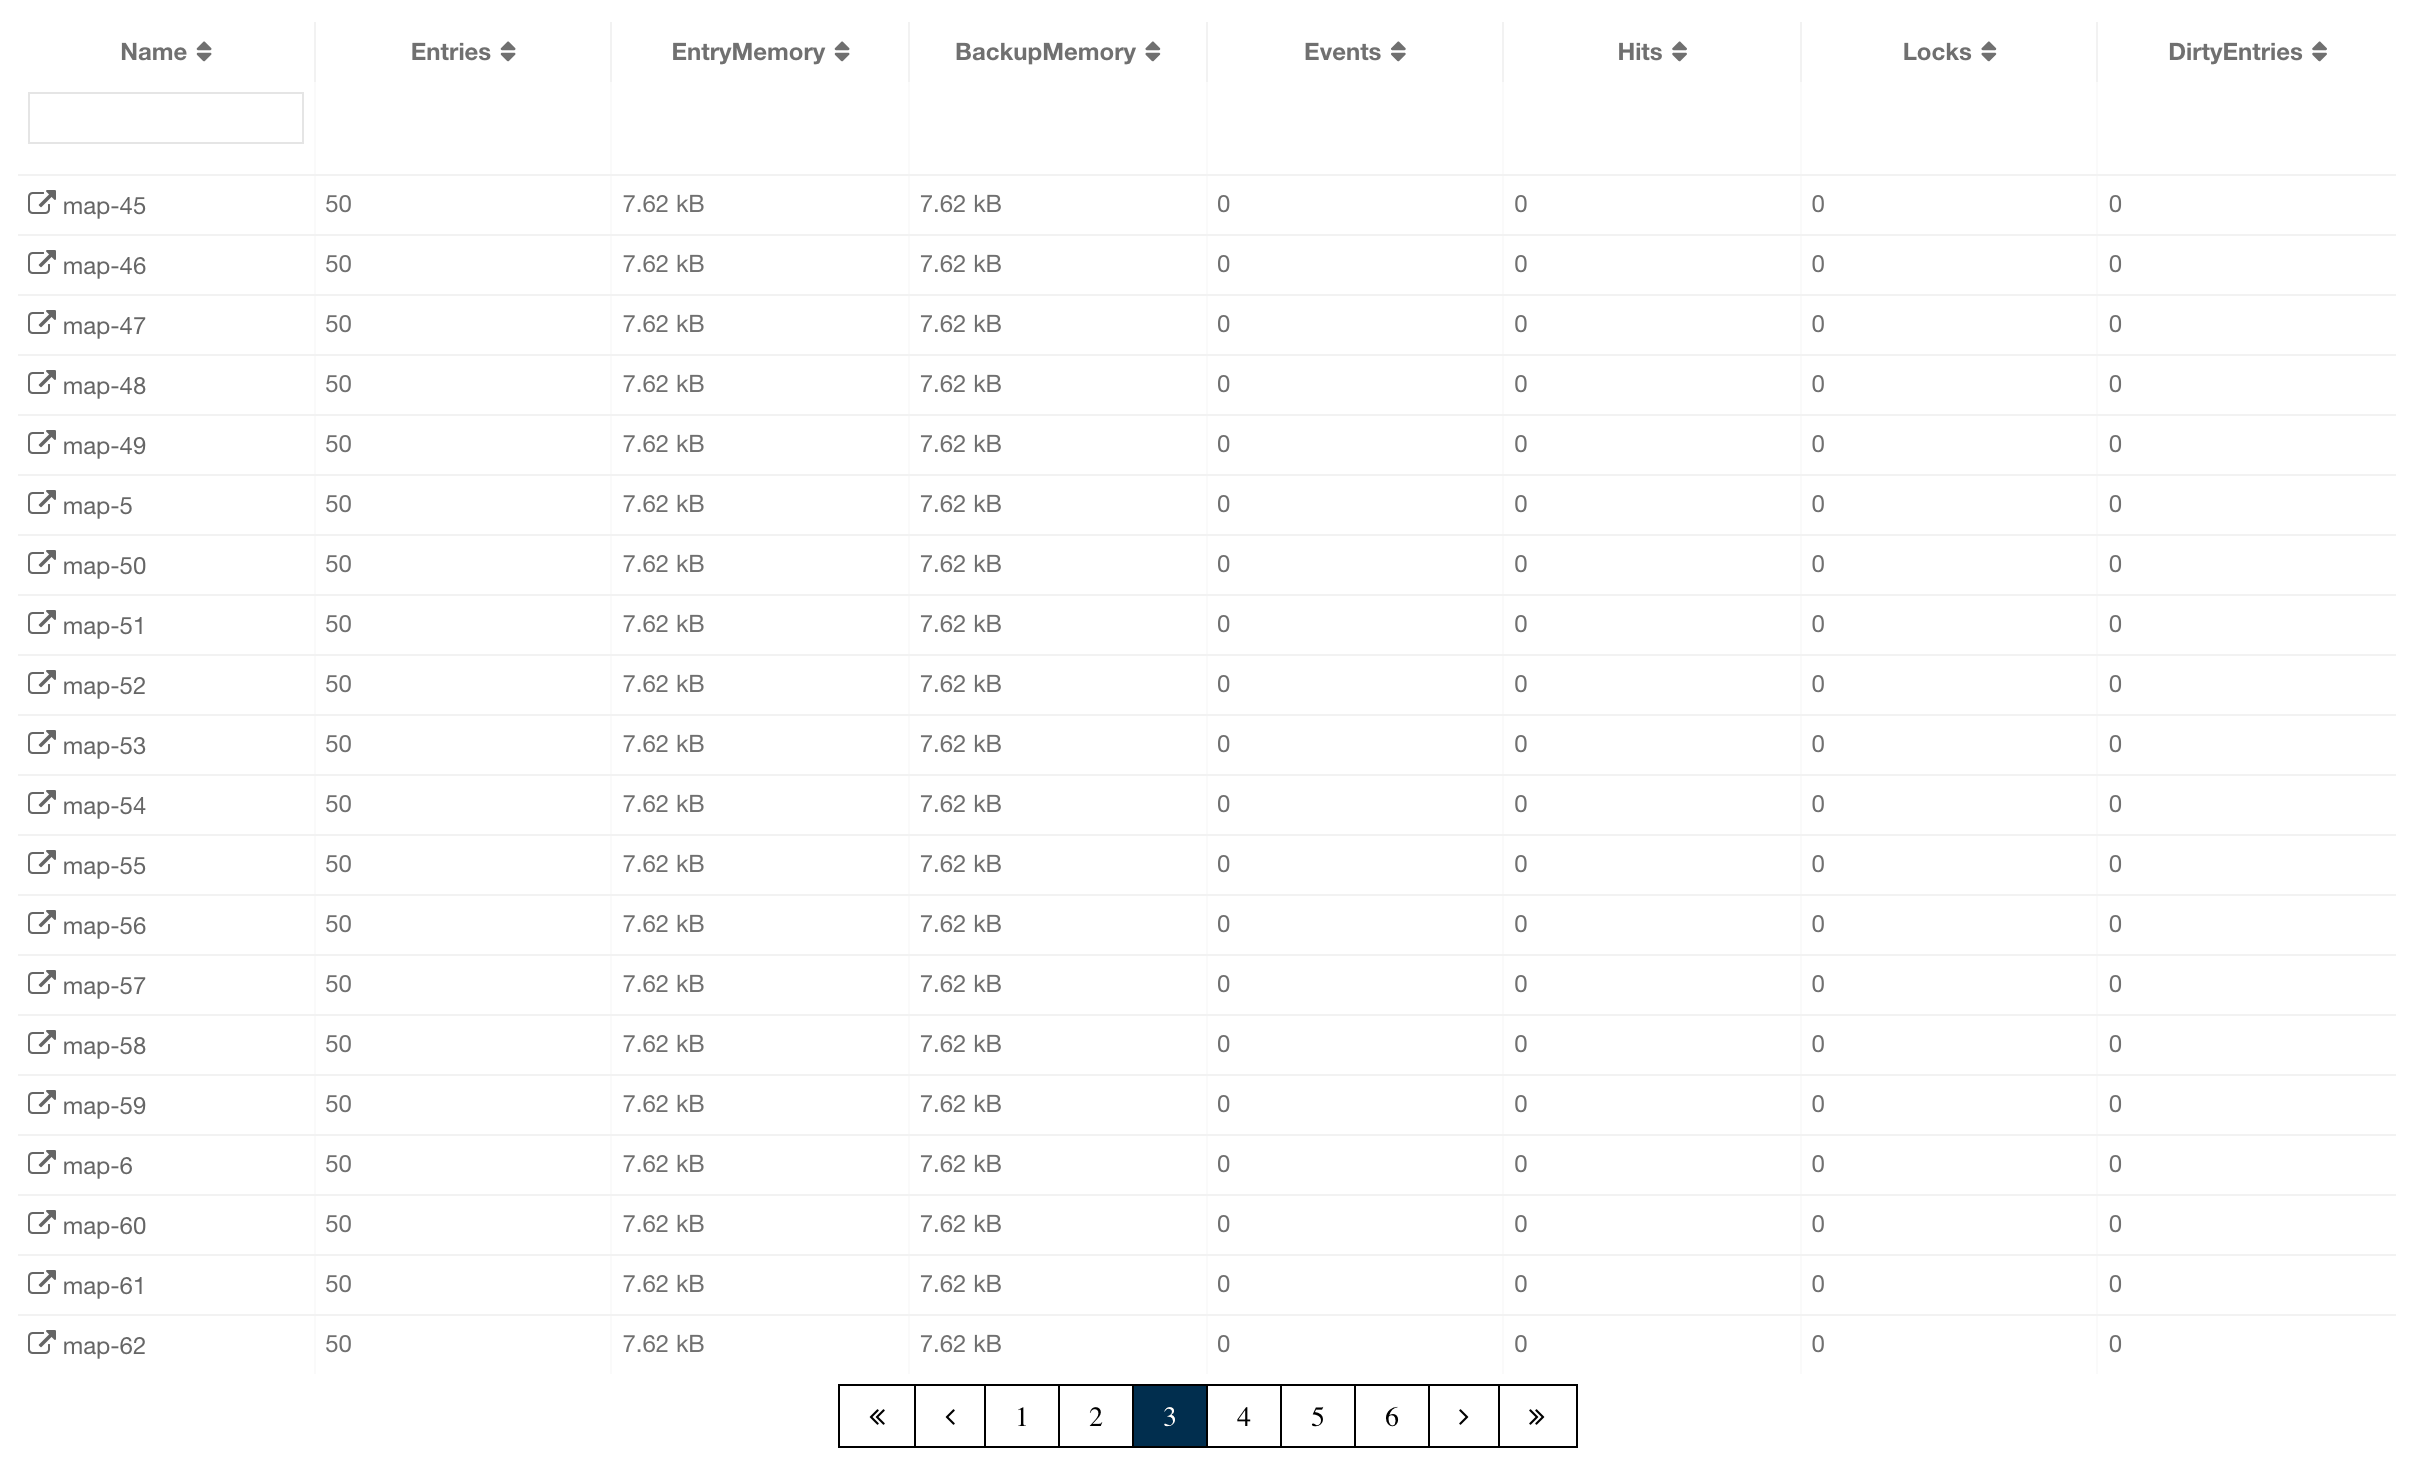
You can filter the maps shown and you can also sort the table by clicking on the column headers. Clicking on a map name opens a new page for monitoring that map instance on the right, as shown below.
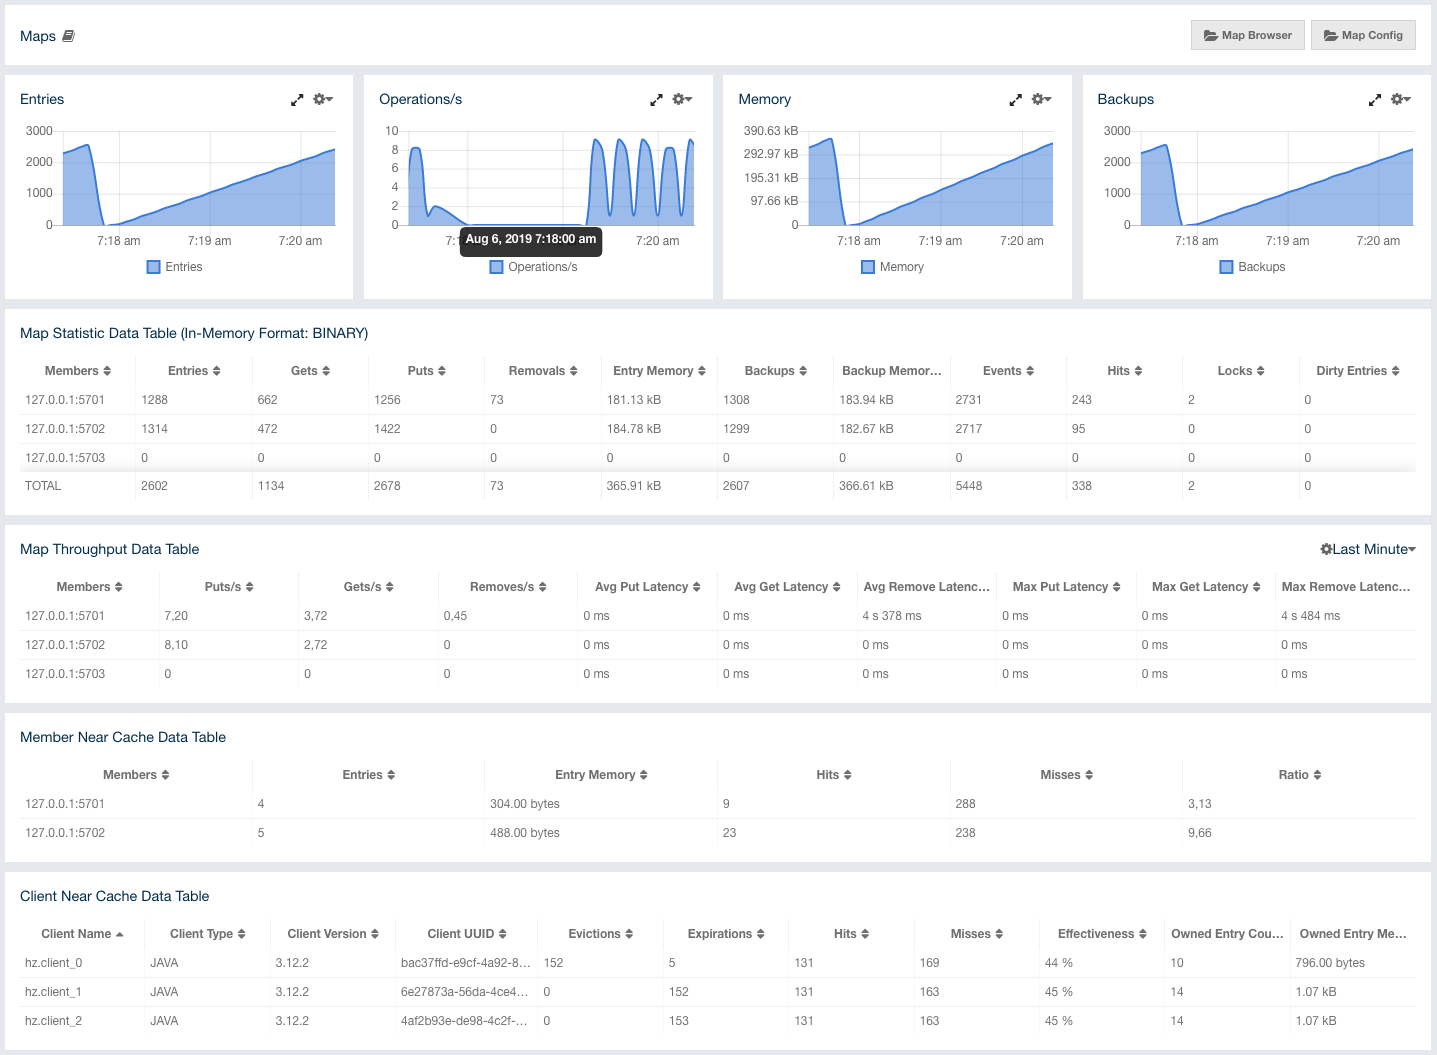
The below subsections explain the portions of this window.
11.1.1. Map Browser
Use the Map Browser tool to retrieve properties of the entries stored in the selected map. To open the Map Browser tool, click on the Map Browser button, located at the top right of the window. Once opened, the tool appears as a dialog, as shown below.
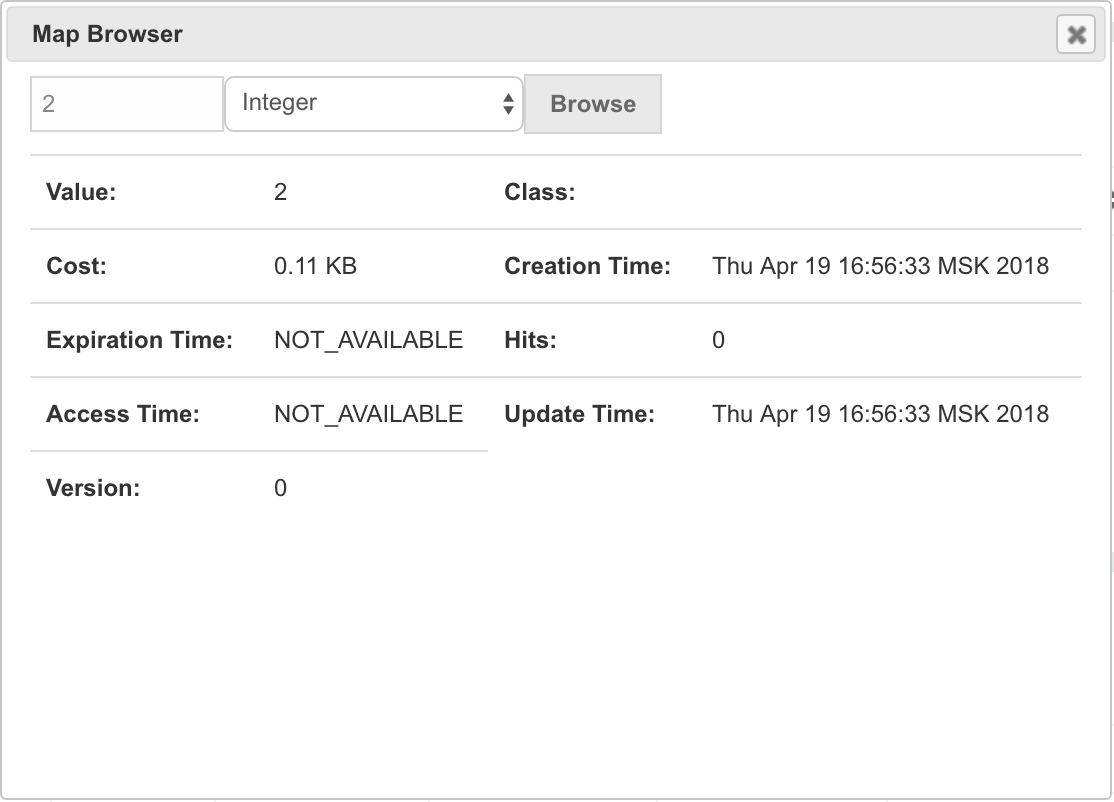
Once the key and the key’s type are specified and the Browse button is clicked, the key’s properties along with its value are listed.
11.1.2. Map Config
Use the Map Config tool to set the selected map’s attributes, such as the backup count, TTL, and eviction policy. To open the Map Config tool, click on the Map Config button, located at the top right of the window. Once opened, the tool appears as a dialog, as shown below.
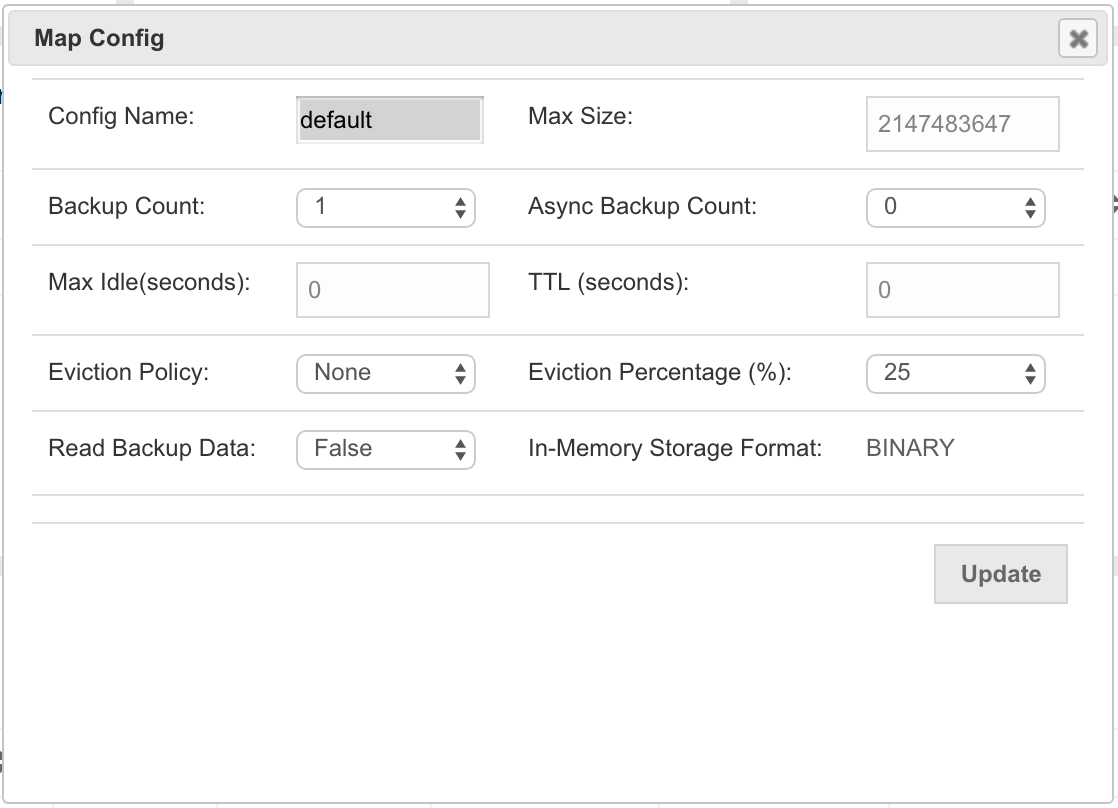
You can change any attribute and click the Update button to save your changes.
11.1.3. Map Monitoring
Besides the Map Browser and Map Config tools, the map monitoring page has monitoring options that are explained below. All of these options perform real-time monitoring.
On top of the page, small charts monitor the entries, operations
per second, memory usage, backup size, etc. of the selected map
in real-time. The X-axis of all the charts show the current
system time. You can select other small monitoring charts using
the  button at the top
right of each chart. When you click the button, the monitoring
options are listed, as shown below.
button at the top
right of each chart. When you click the button, the monitoring
options are listed, as shown below.
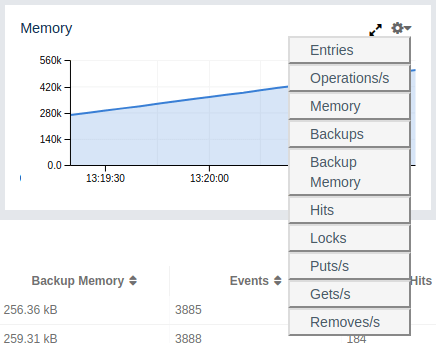
When you click on a desired monitoring, the chart is loaded with
the selected option. To open a chart as a separate dialog, click
on the button placed at the top
right of each chart. The monitoring charts below are available:
-
Entries: Monitors number of locally owned entries.
-
Memory: Monitors the total memory cost of locally owned entries.
-
Backups: Monitors number of backup entries.
-
Backup Memory: Monitors the total memory cost of backup entries.
-
Hits: Monitors number of hits (reads) of locally owned entries, including those which are no longer in the map (for example, may have been evicted). The number of hits may be inaccurate after a partition is migrated to a new owner member.
-
Locks: Monitors number of locally owned entries that are locked.
-
Operations/s: Monitors the total number of all operations performed on the map per second.
-
Puts/s, Gets/s, Removes/s: These three charts monitor the put, get and remove operations performed on the map per second.
Under these charts are Map Statistics, Map Throughput, Member Near Cache, and Client Near Cache data tables.
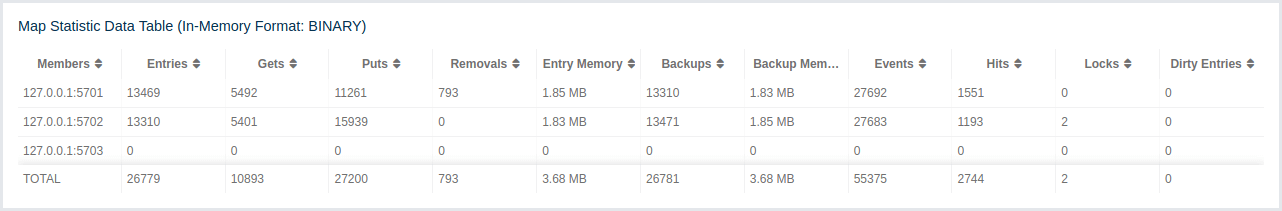
From left to right, this table lists the following:
-
Members: IP address and port of the member.
-
Entries: Number of entries owned by the member.
-
Gets: Number of get operations received by the member.
-
Puts: Number of put operations received by the member.
-
Removes: Number of remove operations received by the member.
-
Entry Memory: Memory cost of owned entries in the member.
-
Backups: Number of backup entries held by the member.
-
Backup Memory: Memory cost of backup entries held by the member.
-
Events: Number of events received by the member.
-
Hits: Number of hits (reads) of the entries that are owned by the member, including those which are no longer in the map (for example, may have been evicted). The number of hits may be inaccurate after a partition is migrated to a new owner member.
-
Locks: Number of currently locked entries owned by the member.
-
Dirty Entries: Number of entries that the member owns and are dirty (updated but not persisted yet). In the cases where MapStore is enabled, these are the entries that are put to/removed from the map but not written to/removed from a database yet.
You can ascend or descend the order of the listings by clicking on the column headings.
Map Throughput Data Table provides information about the operations (get, put, remove) performed on each member in the map, as shown below.
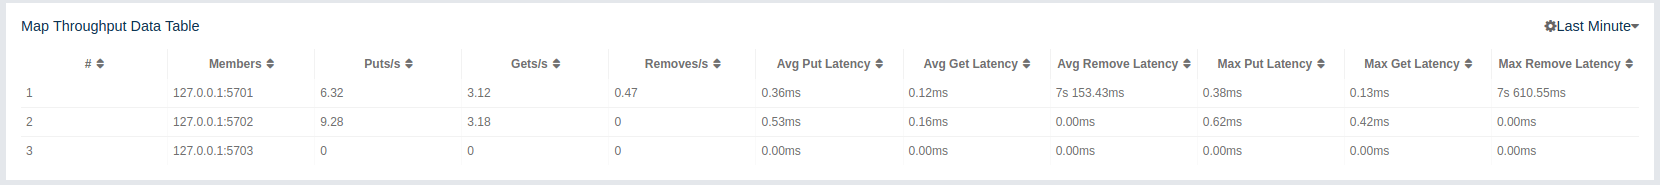
From left to right, this table lists the following:
-
Members: IP address and port of the member.
-
Puts/s: Number of put operations per second on the member.
-
Gets/s: Number of get operations per second on the member.
-
Removes/s: Number of remove operations per second on the member.
-
Avg Put Latency: Average latency of put operations on the member.
-
Avg Get Latency: Average latency of get operations on the member.
-
Avg Remove Latency: Average latency of remove operations on the member.
-
Max Put Latency: Maximum latency of put operations on the member.
-
Max Get Latency: Maximum latency of get operations on the member.
-
Max Remove Latency: Maximum latency of remove operations on the member.
You can select the time period in the combo box placed on the top right corner of the window, for which the table data will be shown. Available values are Since Beginning, Last Minute, Last 10 Minutes and Last 1 Hour.
To ascend or descend the order of the listings, click on the column headings.
Member Near Cache Data Table provides information about the Member Near Caches, if available, on each member, as shown below.
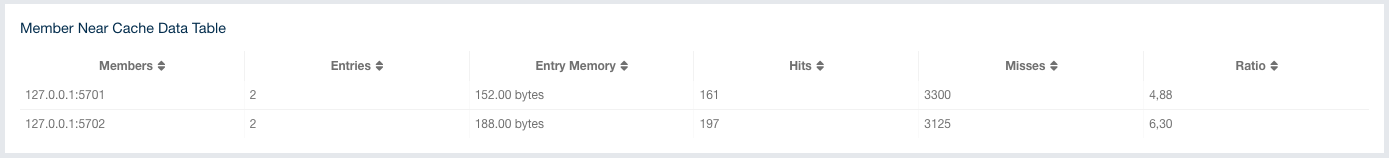
From left to right, this table lists the following:
-
Members: IP address and port of the member which has Near Caches defined for the maps.
-
Entries: Count of the entries in each Near Cache.
-
Entry Memory: Memory cost of the entries in each Near Cache.
-
Hits: Count of the entries read from the Near Cache.
-
Misses: Count of the entries which cannot be found in the Near Cache when requested to read.
-
Ratio: Hits/Misses ratio.
To ascend or descend the order of the listings, click on the column headings.
Client Near Cache Summary provides summary information related to the Near Cache statistics aggregated for all the clients that have Near Cache enabled for this map. Aggregated statistics are shown for the following periods: 1 minute, 5 minutes, 30 minutes and 60 minutes. Currently, the table shows overall Near Cache effectiveness, calculated as hits/total reads ratio.
| You need to enable the statistics for clients to see them here. Please refer to Monitoring Clients for details. |

Client Near Cache Data Table provides information about the Near Caches statistics, if available, on each client that has Near Cache enabled for this map, as shown below.
| You need to enable the statistics for clients to see them here. Please refer to Monitoring Clients for details. |
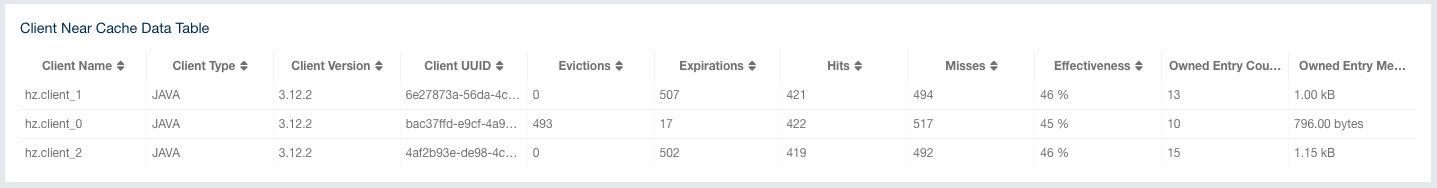
From left to right, this table lists the following:
-
Client Name: Name of the client instance which has Near Cache defined for the map.
-
Client Type: Type of the client.
-
Client Version: Version of the client.
-
Client UUID: Client unique identifier.
-
Evictions: Number of evictions of Near Cache entries owned by the client.
-
Expirations: Number of TTL and max-idle expirations of Near Cache entries owned by the client.
-
Hits: Number of hits (reads) of Near Cache entries owned by the client.
-
Misses: Number of misses of Near Cache entries owned by the client.
-
Effectiveness: Hits/total reads ratio.
-
Owned Entry Count: Number of Near Cache entries owned by the client.
-
Owned Entry Memory Cost: Memory cost of Near Cache entries owned by the client.
To ascend or descend the order of the listings, click on the column headings.
11.2. Caches
You can see a list of all the caches in your cluster by clicking on the Caches menu item on the left panel. A new page is opened on the right, as shown below.
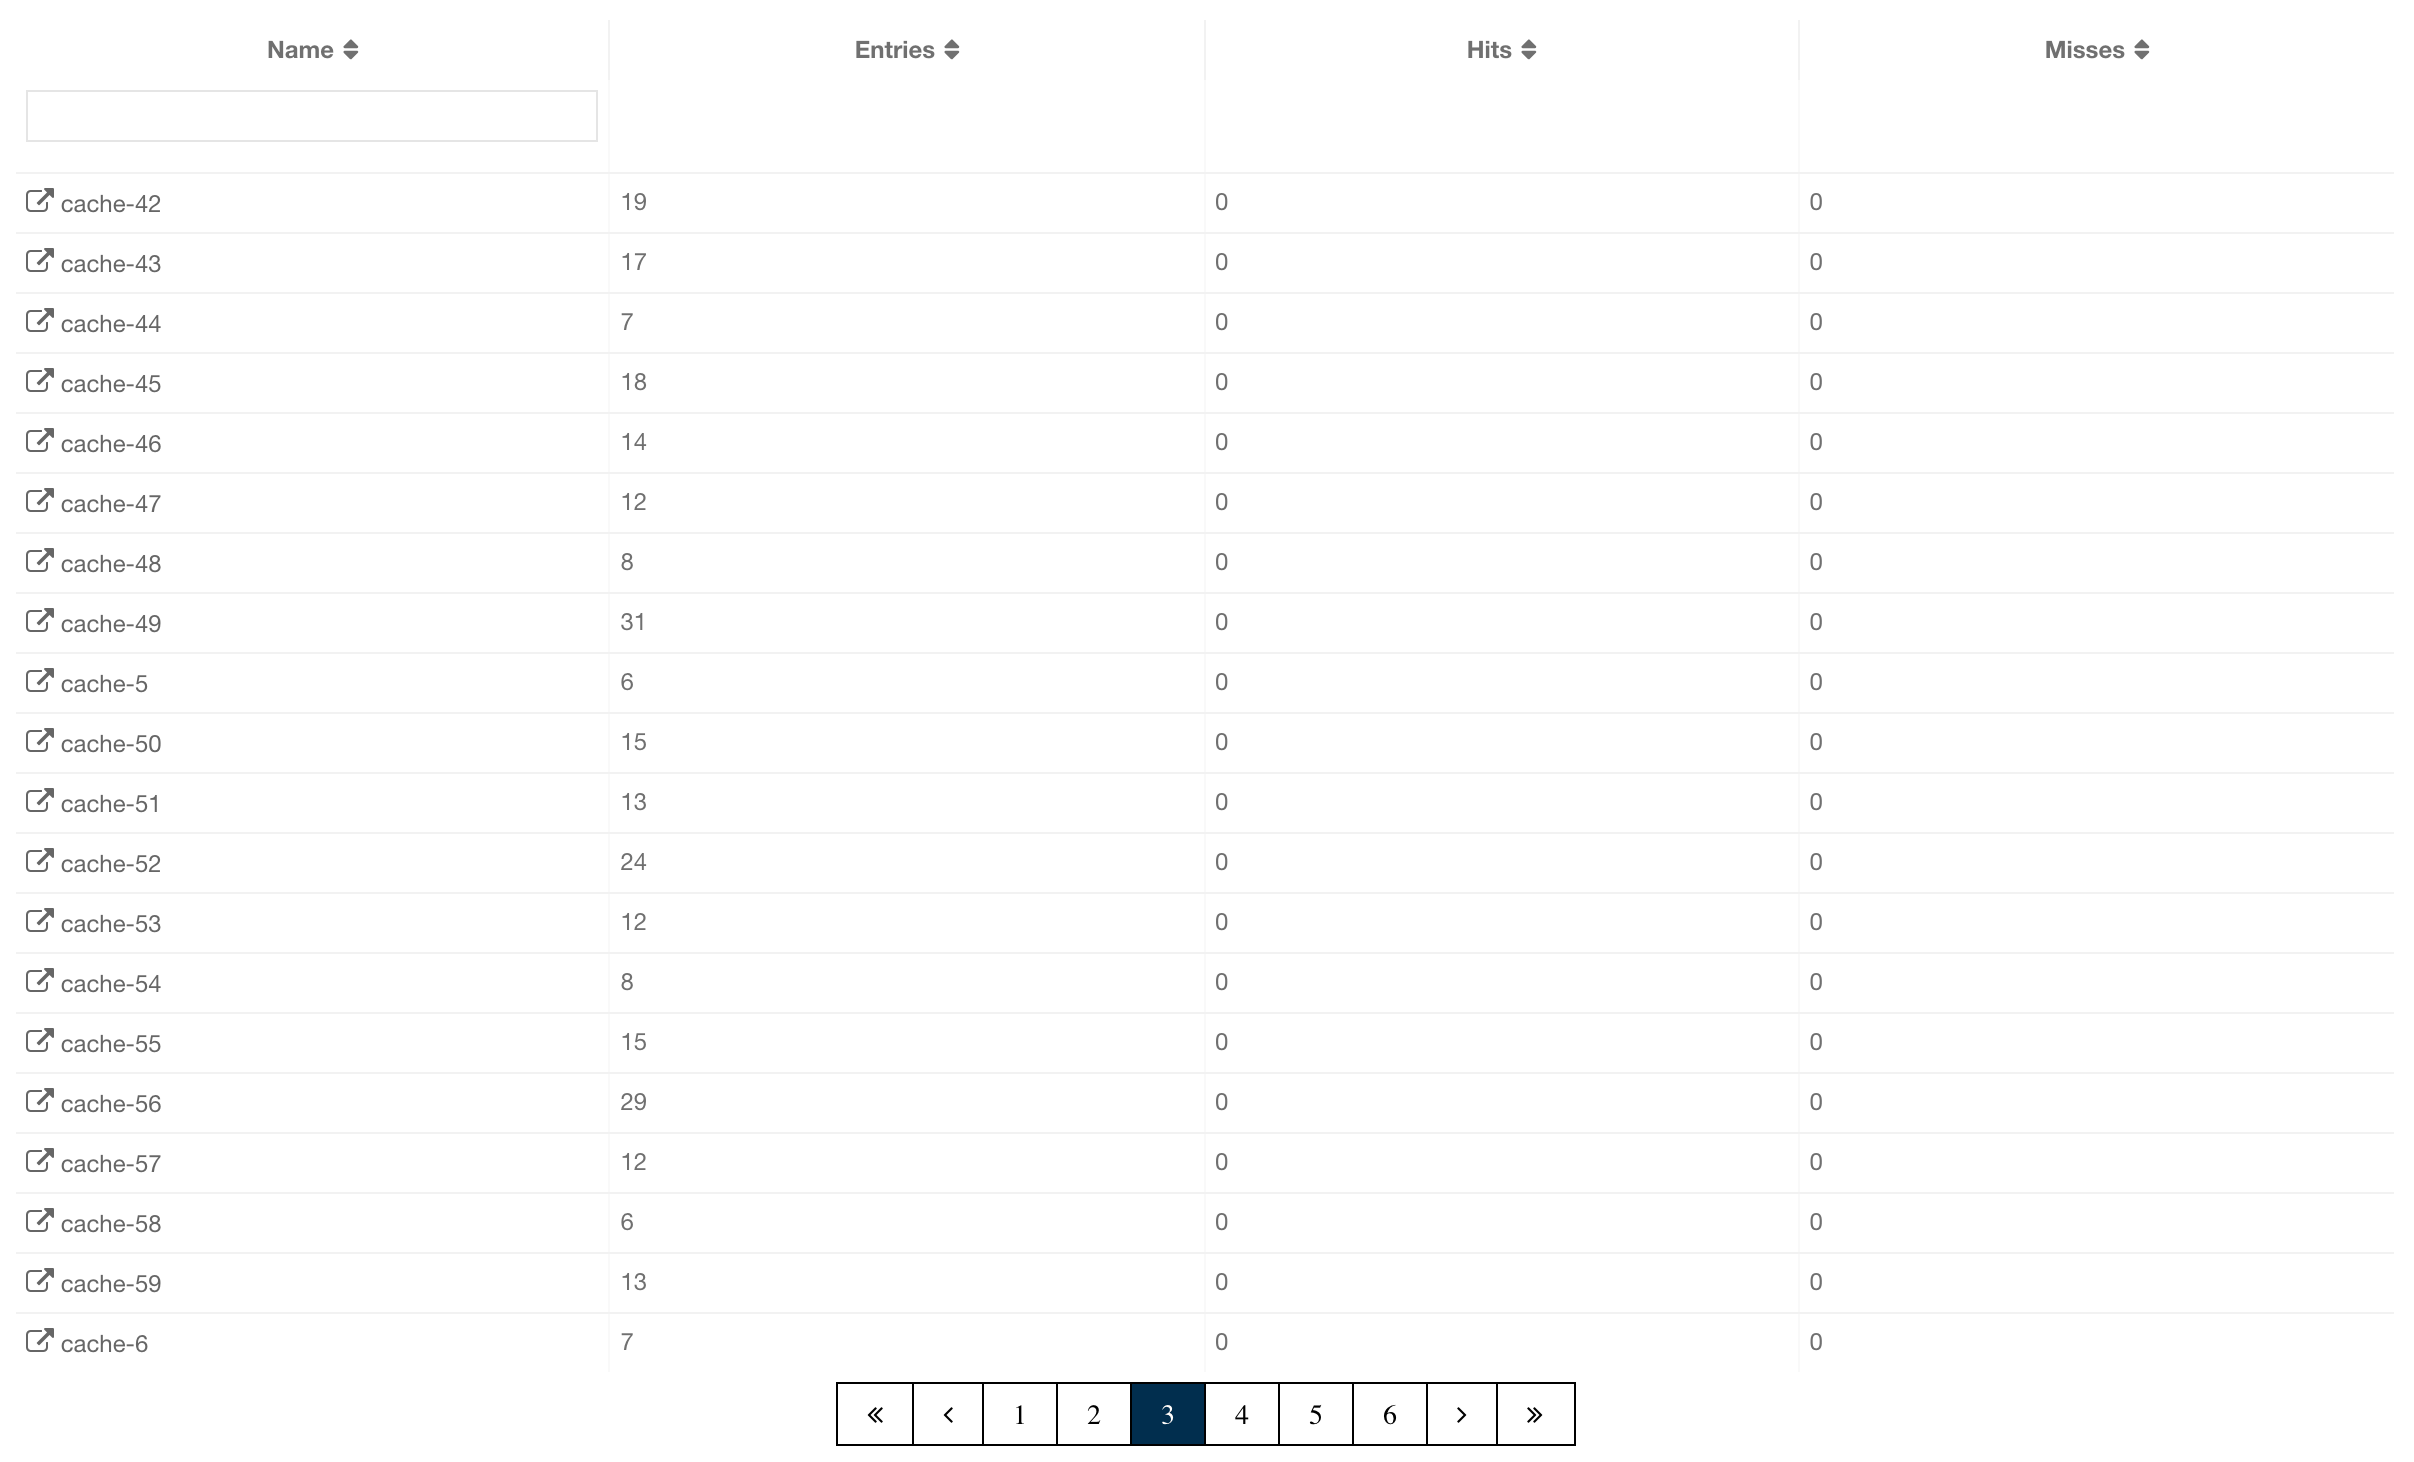
You can filter the caches shown and you can also sort the table by clicking on the column headers. Clicking on the cache name opens a new page for monitoring that cache instance on the right, as shown below.
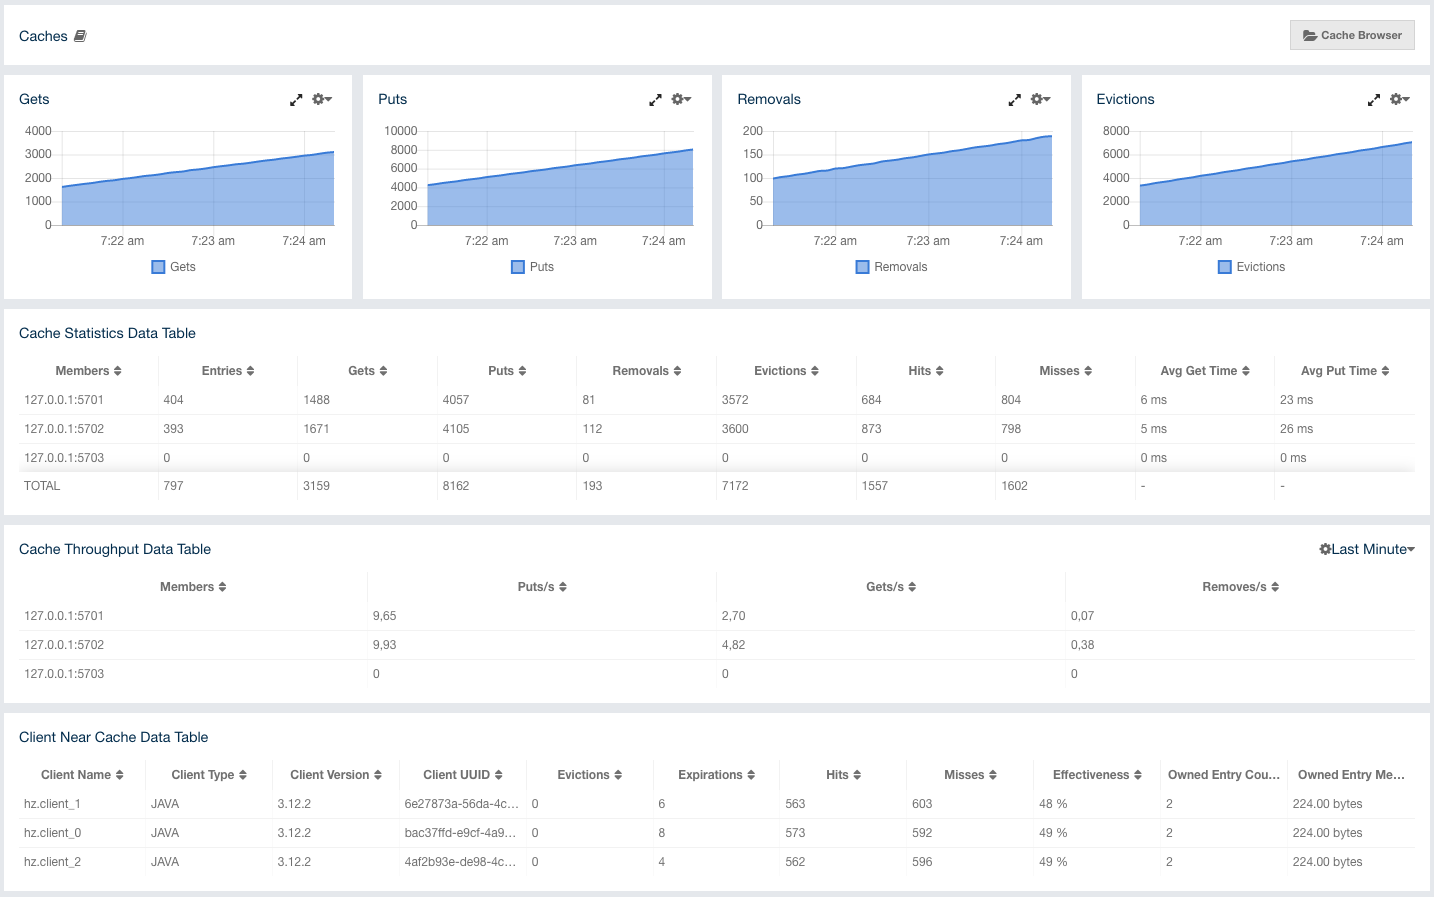
On top of the page, four charts monitor the Gets, Puts,
Removals and Evictions in real-time. The X-axis of all the
charts show the current system time. To open a chart as a separate
dialog, click on the button placed
at the top right of each chart.
Under these charts are Cache Statistics, Cache Throughput, and Client Near Cache data tables.
Cache Statistics Data Table provides the selected cache’s statistics distributed over the members, as shown below.
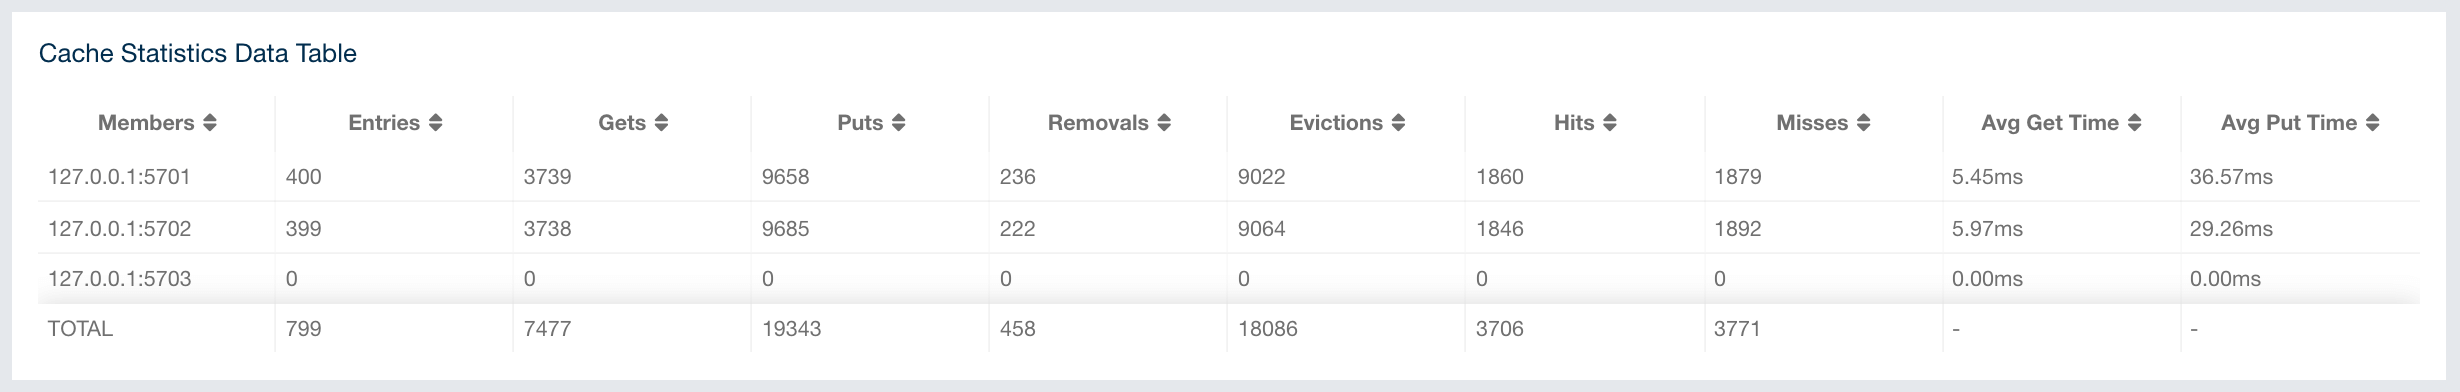
From left to right, this table lists the following in real time:
-
Members: IP address and port of the member.
-
Entries: Number of entries in this cache owned by the member.
-
Gets/Puts/Removals: Number of the get/put/remove operations for this cache received by the member.
-
Hits: Number of the reads performed for this cache’s entries.
-
Misses: Number of the entries which cannot be found in the cache when requested to read.
-
Avg Get/Put Time: Average elapsed time for the get and put operations for the cache on each member.
To ascend or descend the order of the listings, click on the column headings.
Cache Throughput Data Table provides information about the operations (get, put, remove) performed on each member for the selected cache.
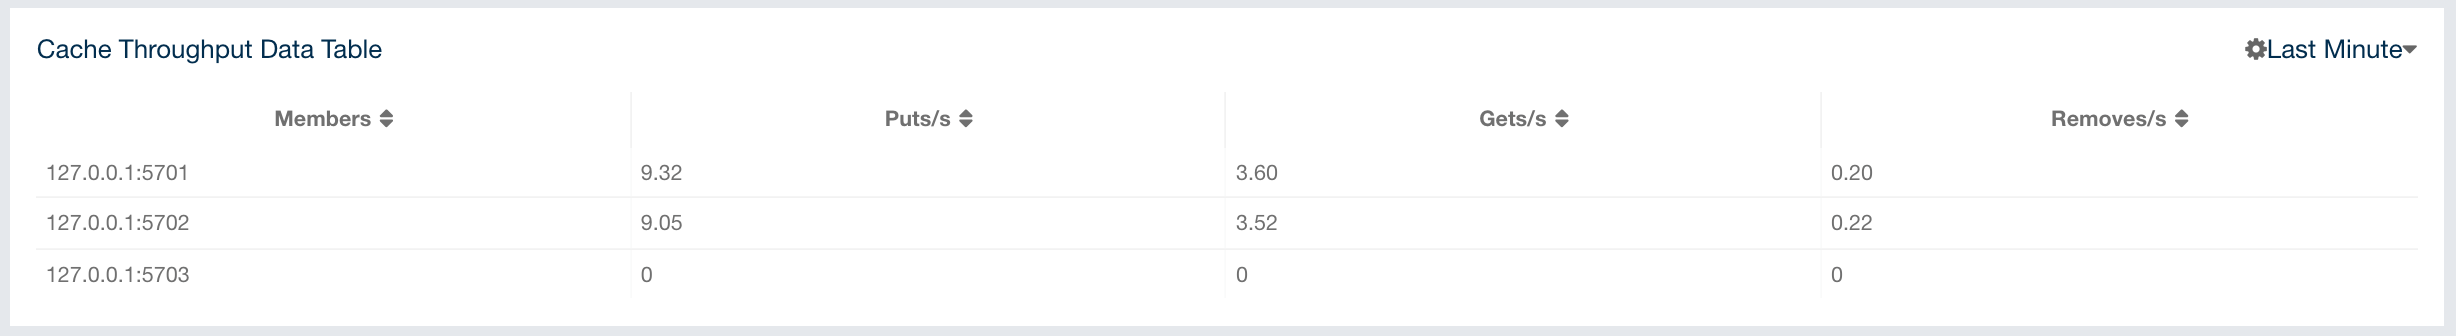
From left to right, this table lists the following:
-
IP address and port of each member.
-
Put, get and remove operation rates on each member for this cache.
You can select the period in the combo box placed at the top right corner of the window, for which the table data will be shown. Available values are Since Beginning, Last Minute, Last 10 Minutes and Last 1 Hour.
You can ascend or descend the order of the listings in each column by clicking on column headings.
Client Near Cache Summary provides summary information related to the Near Cache statistics aggregated for all the clients that have Near Cache enabled for this cache. Aggregated statistics are shown for the following periods: 1 minute, 5 minutes, 30 minutes and 60 minutes. Currently, the table shows overall Near Cache effectiveness, calculated as hits/total reads ratio.
| You need to enable the statistics for clients to see them here. Please refer to Monitoring Clients for details. |
Client Near Cache Data Table provides information about the Near Caches statistics, if available, on each client that has Near Cache enabled for this cache, as shown below.
| You need to enable the statistics for clients to see them here. Please refer to Monitoring Clients for details. |
From left to right, this table lists the following:
-
Client Name: Name of the client instance which has Near Cache enabled for the map.
-
Client Type: Type of the client.
-
Client Version: Version of the client.
-
Client UUID: Client unique identifier.
-
Evictions: Number of evictions of Near Cache entries owned by the client.
-
Expirations: Number of TTL and max-idle expirations of Near Cache entries owned by the client.
-
Hits: Number of hits (reads) of Near Cache entries owned by the client.
-
Misses: Number of misses of Near Cache entries owned by the client.
-
Effectiveness: Hits/total reads ratio.
-
Owned Entry Count: Number of Near Cache entries owned by the client.
-
Owned Entry Memory Cost: Memory cost of Near Cache entries owned by the client.
To ascend or descend the order of the listings, click on the column headings.
You need to enable the statistics for caches to monitor them
in the Management Center. Use the <statistics-enabled> element or
setStatisticsEnabled() method in declarative or programmatic
configuration, respectively, to enable the statistics. Please refer
to the JCache Declarative Configuration
section for more information.
|
11.3. Replicated Maps
You can see a list of all the Replicated Maps in your cluster by clicking on the Replicated Maps menu item on the left panel. A new page is opened on the right, as shown below.
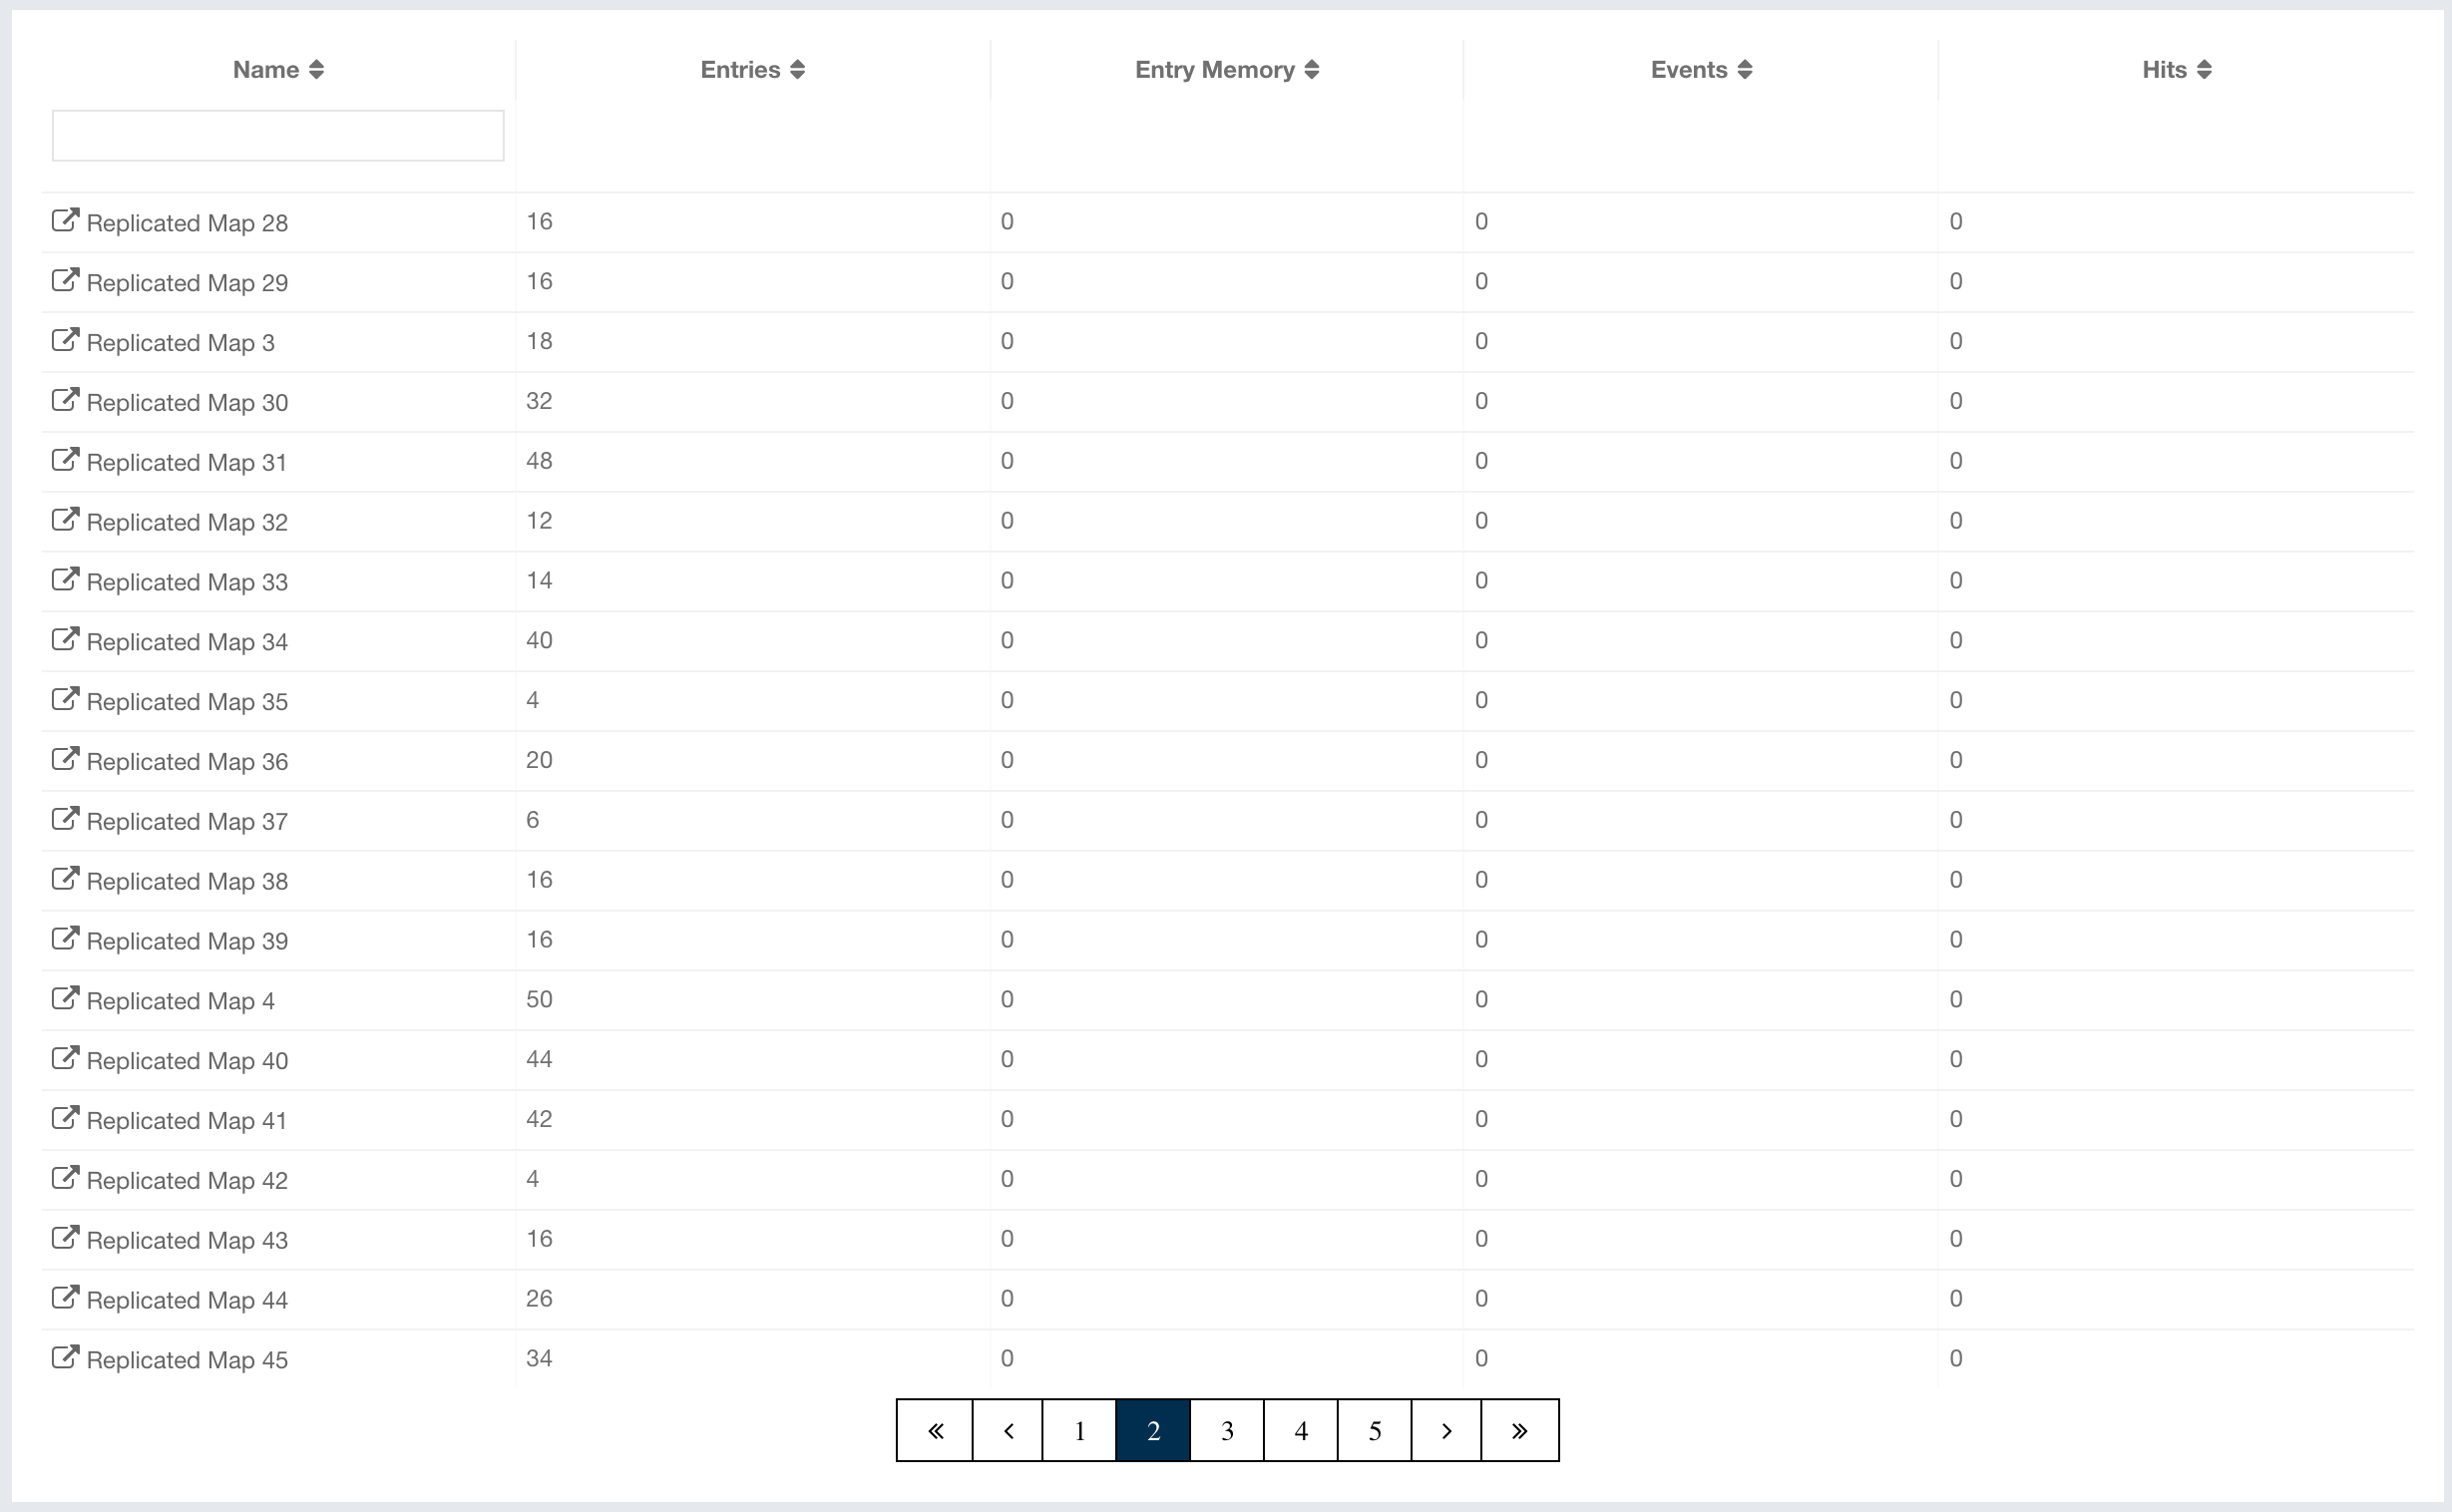
You can filter the Replicated Maps shown and you can also sort the table by clicking on the column headers. Clicking on a Replicated Map name opens a new page for monitoring that Replicated Map instance on the right, as shown below.
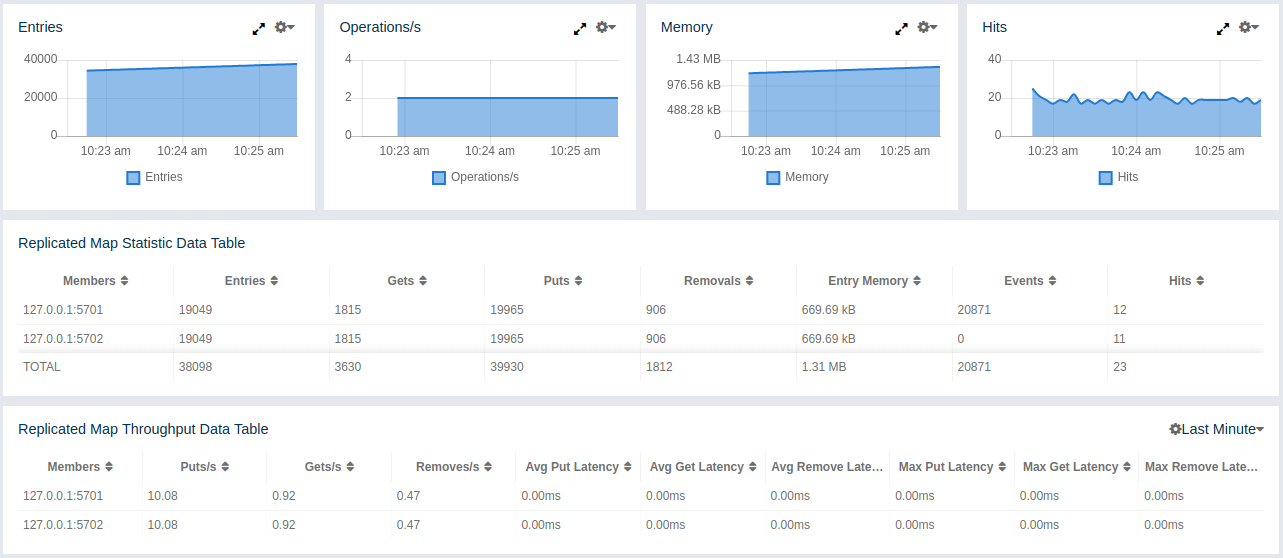
In this page, you can monitor metrics and also re-configure the selected Replicated Map. All of the statistics are real-time monitoring statistics.
When you click on a desired monitoring, the chart is loaded with the selected option. Also you can open the chart in new window.
-
Entries: Monitors number of entries of the Replicated Map.
-
Operations/s: Monitors number of all operations performed on the Replicated Map per second.
-
Memory: Monitors memory usage of the Replicated Map.
-
Hits: Monitors hit count of the Replicated Map.
-
Puts/s, Gets/s, Removes/s: These three charts monitor the put, get and remove operations performed on the selected Replicated Map per second.
Under these charts are Replicated Map Statistics and Replicated Map Throughput data tables.
Replicated Map Statistics Data Table provides statistics distributed over the members, as shown below.
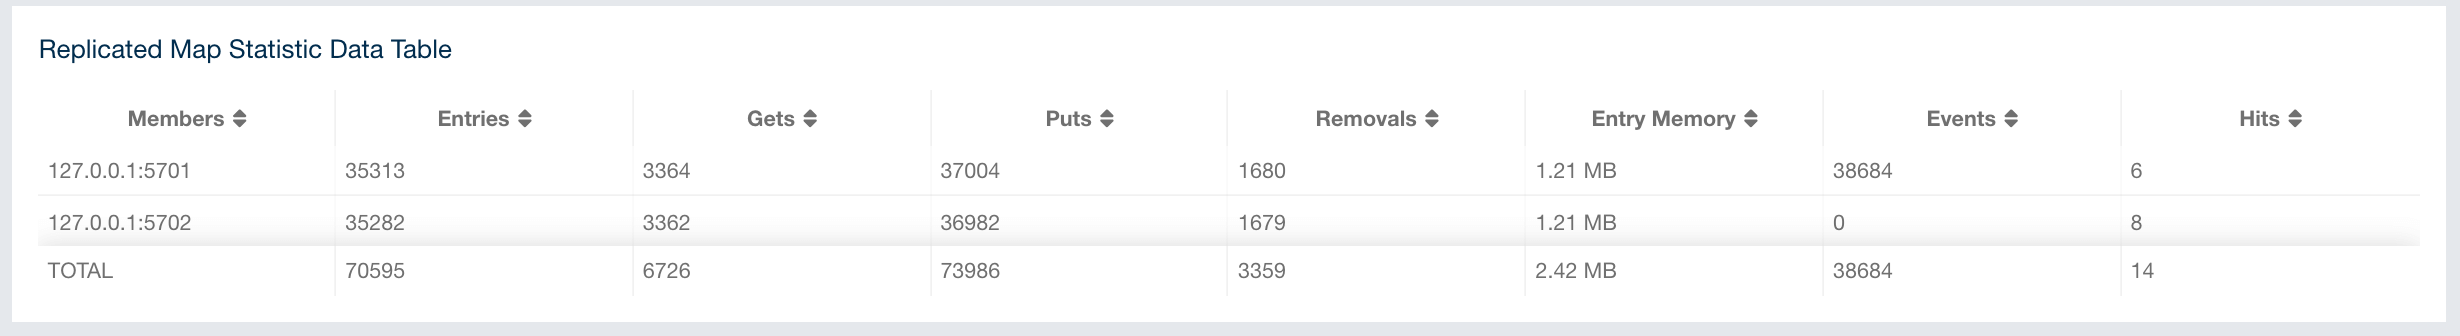
From left to right, this table lists the following:
-
Members: IP address and port of the member.
-
Entries: Number of entries in this Replicated Map owned by the member.
-
Gets/Puts/Removals: Number of the get/put/remove operations for this Replicated Map received by the member.
-
Entry Memory: Memory cost of the owned entries in the member.
-
Events: Number of the events received by the member.
-
Hits: Number of the reads performed for this Replicated Map’s entries.
Replicated Map Throughput Data Table provides information about operations (get, put, remove) performed on each member in the selected Replicated Map.
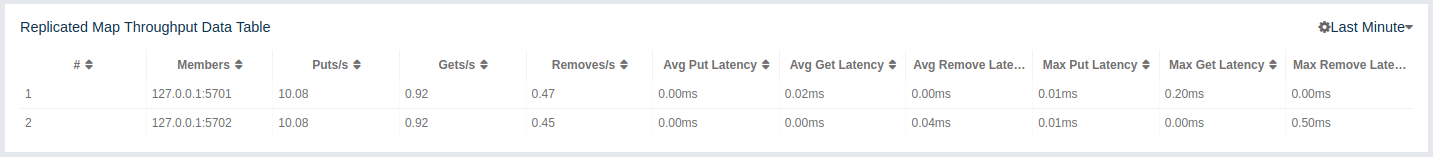
From left to right, this table lists the following:
-
IP address and port of each member
-
put, get, and remove operations on each member
-
average put, get, and remove latencies
-
maximum put, get, and remove latencies on each member.
You can select the period from the combo box placed at the top right corner of the window, in which the table data is shown. Available values are Since Beginning, Last Minute, Last 10 Minutes and Last 1 Hour.
To ascend or descend the order of the listings, click on the column headings.
11.4. MultiMaps
You can see a list of all the MultiMaps in your cluster by clicking on the MultiMaps menu item on the left panel. A new page is opened on the right, as shown below.
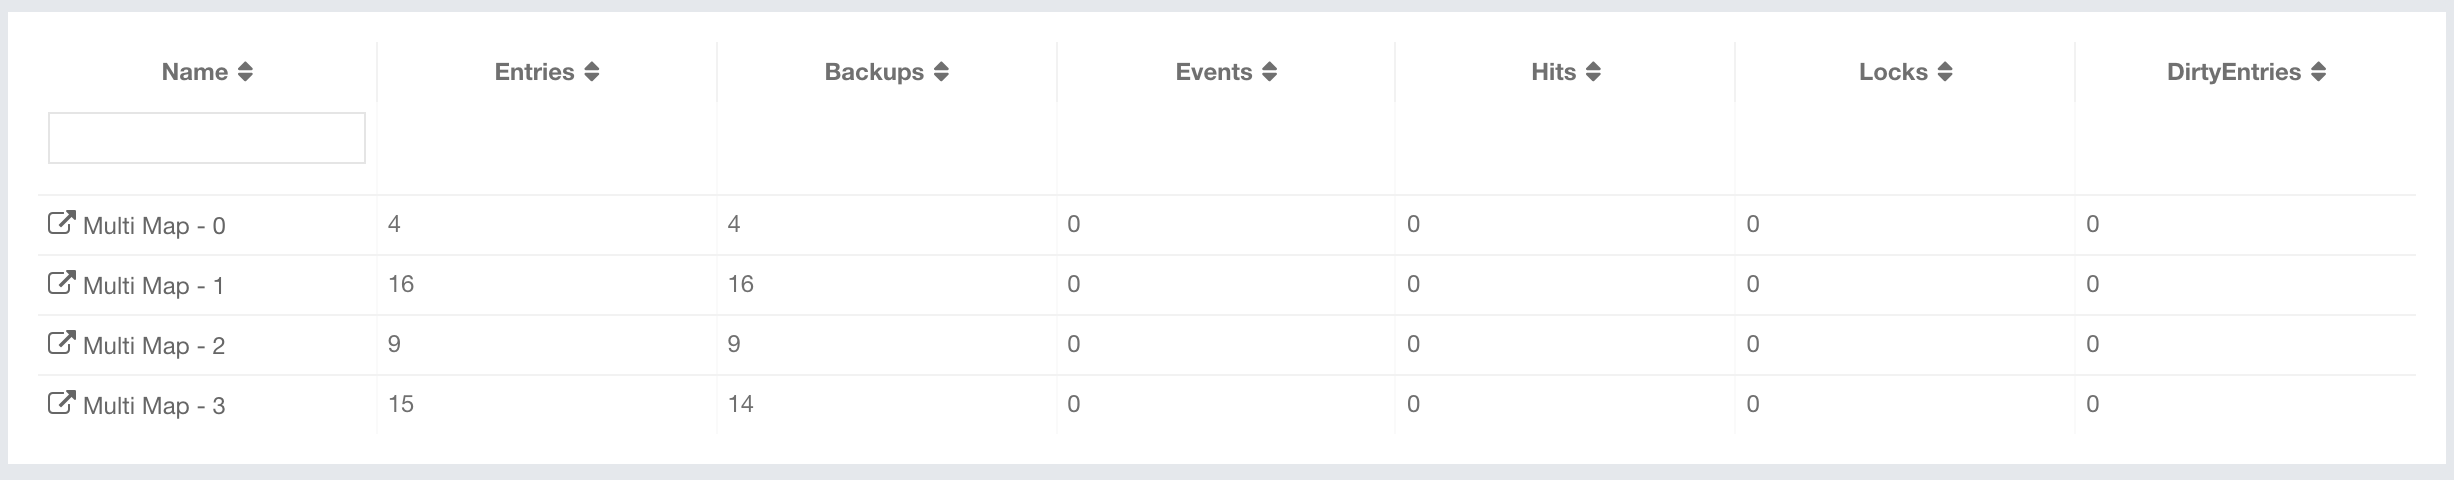
You can filter the MultiMaps shown and you can also sort the table by clicking on the column headers. Clicking on a MultiMap name opens a new page for monitoring that MultiMap instance on the right.
MultiMap is a specialized map where you can associate a key with multiple values. This monitoring option is similar to the Maps option: the same monitoring charts and data tables monitor MultiMaps. The differences are that you cannot browse the MultiMaps and re-configure it. Please see the Managing Maps.
11.5. Queues
You can see a list of all the queues in your cluster by clicking on the Queues menu item on the left panel. A new page is opened on the right, as shown below.
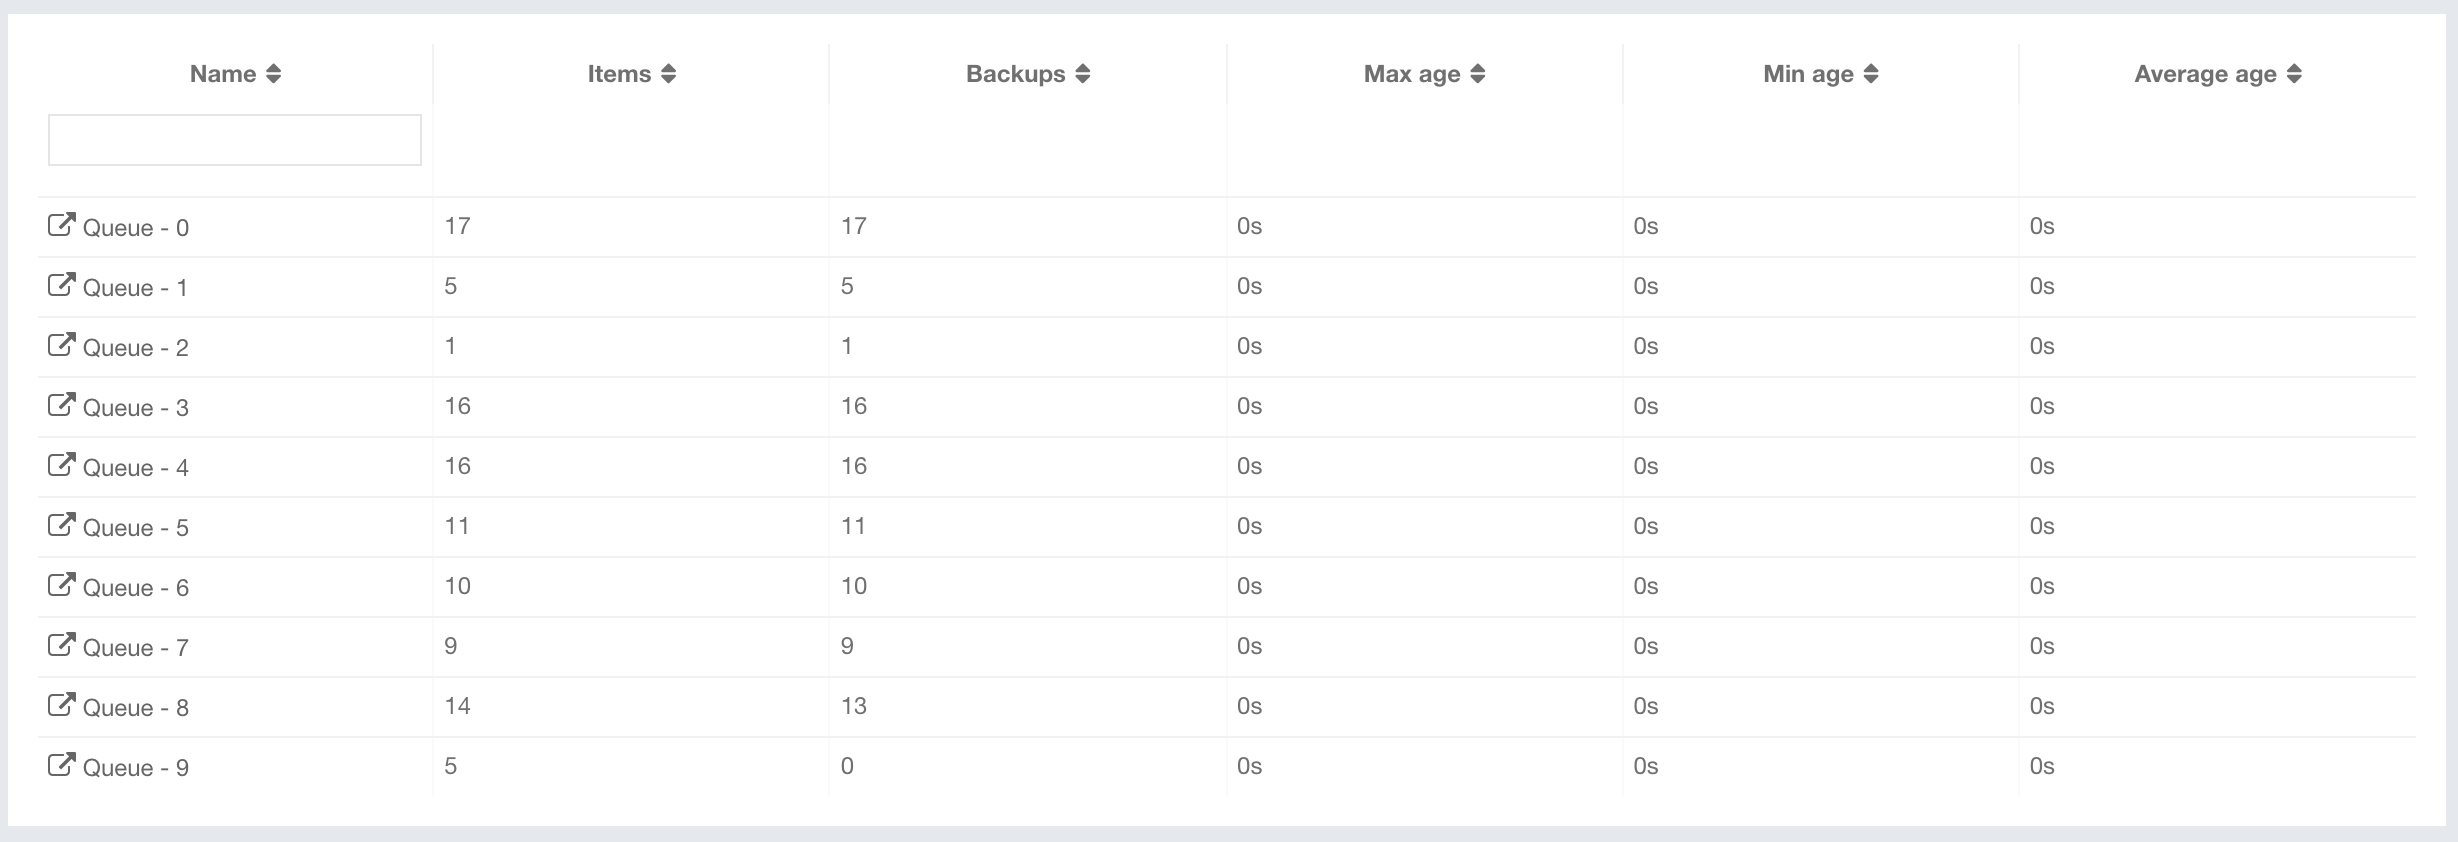
You can filter the queues shown and you can also sort the table by clicking on the column headers. Clicking on a queue name opens a new page for monitoring that queue instance on the right, as shown below.
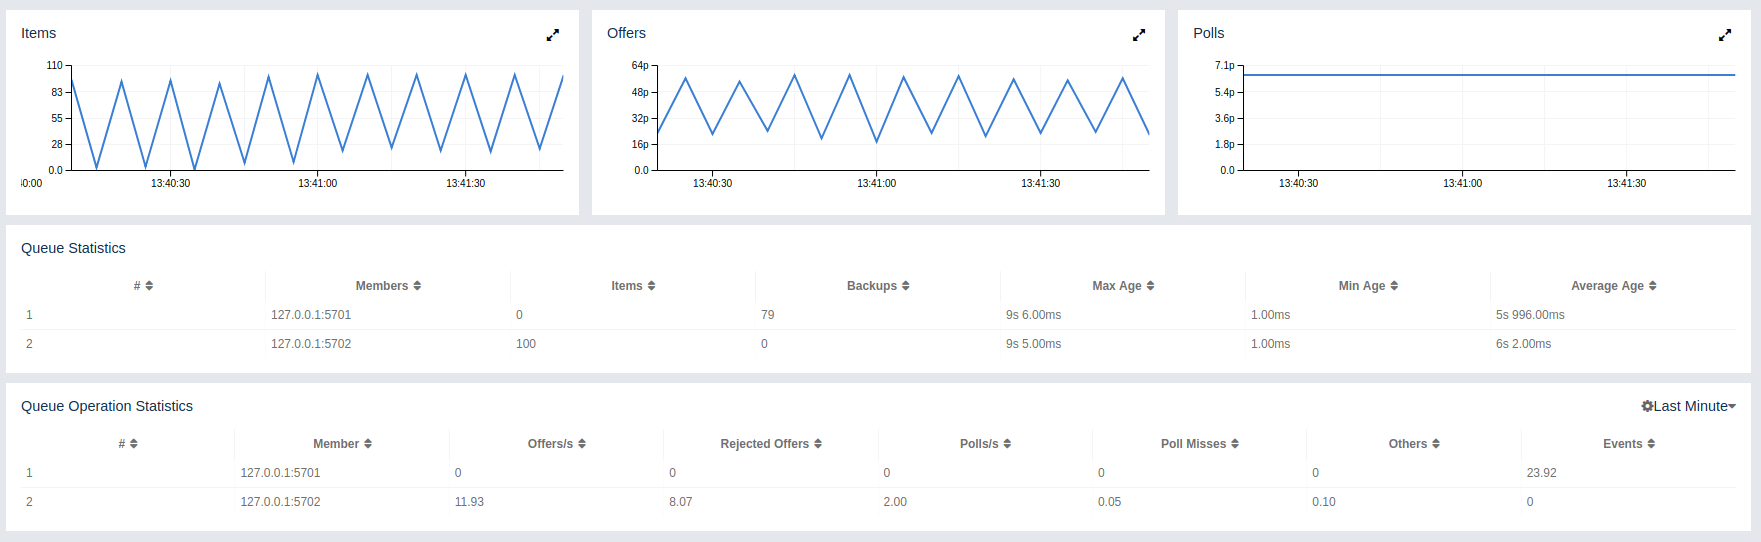
On top of the page, small charts monitor the size, offers and
polls of the selected queue in real-time. The X-axis of all the
charts shows the current system time. To open a chart as a separate
dialog, click on the button
placed at the top right of each chart. The monitoring charts below are available:
-
Items: Monitors the size of the queue. Y-axis is the entry count.
-
Offers: Monitors the offers sent to the selected queue. Y-axis is the offer count.
-
Polls: Monitors the polls sent to the selected queue. Y-axis is the poll count.
Under these charts are Queue Statistics and Queue Operation Statistics tables.
Queue Statistics table provides item and backup item counts in the queue and age statistics of items and backup items at each member, as shown below.

From left to right, this table lists the IP address and port, items and backup items on the queue of each member, and maximum, minimum and average age of items in the queue. The order of the listings in each column can be ascended or descended by clicking on the column headings.
Queue Operation Statistics table provides information about the operations (offers, polls, events) performed on the queues, as shown below.
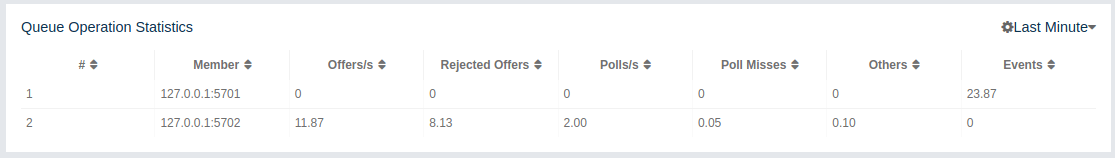
From left to right, this table lists the IP address and port of each member, and counts of offers, rejected offers, polls, poll misses and events.
You can select the period in the combo box placed at the top right corner of the window to show the table data. Available values are Since Beginning, Last Minute, Last 10 Minutes and Last 1 Hour.
Click on the column headings to ascend or descend the order of the listings.
11.6. Topics
You can see a list of all the topics in your cluster by clicking on the Topics menu item on the left panel. A new page is opened on the right, as shown below.
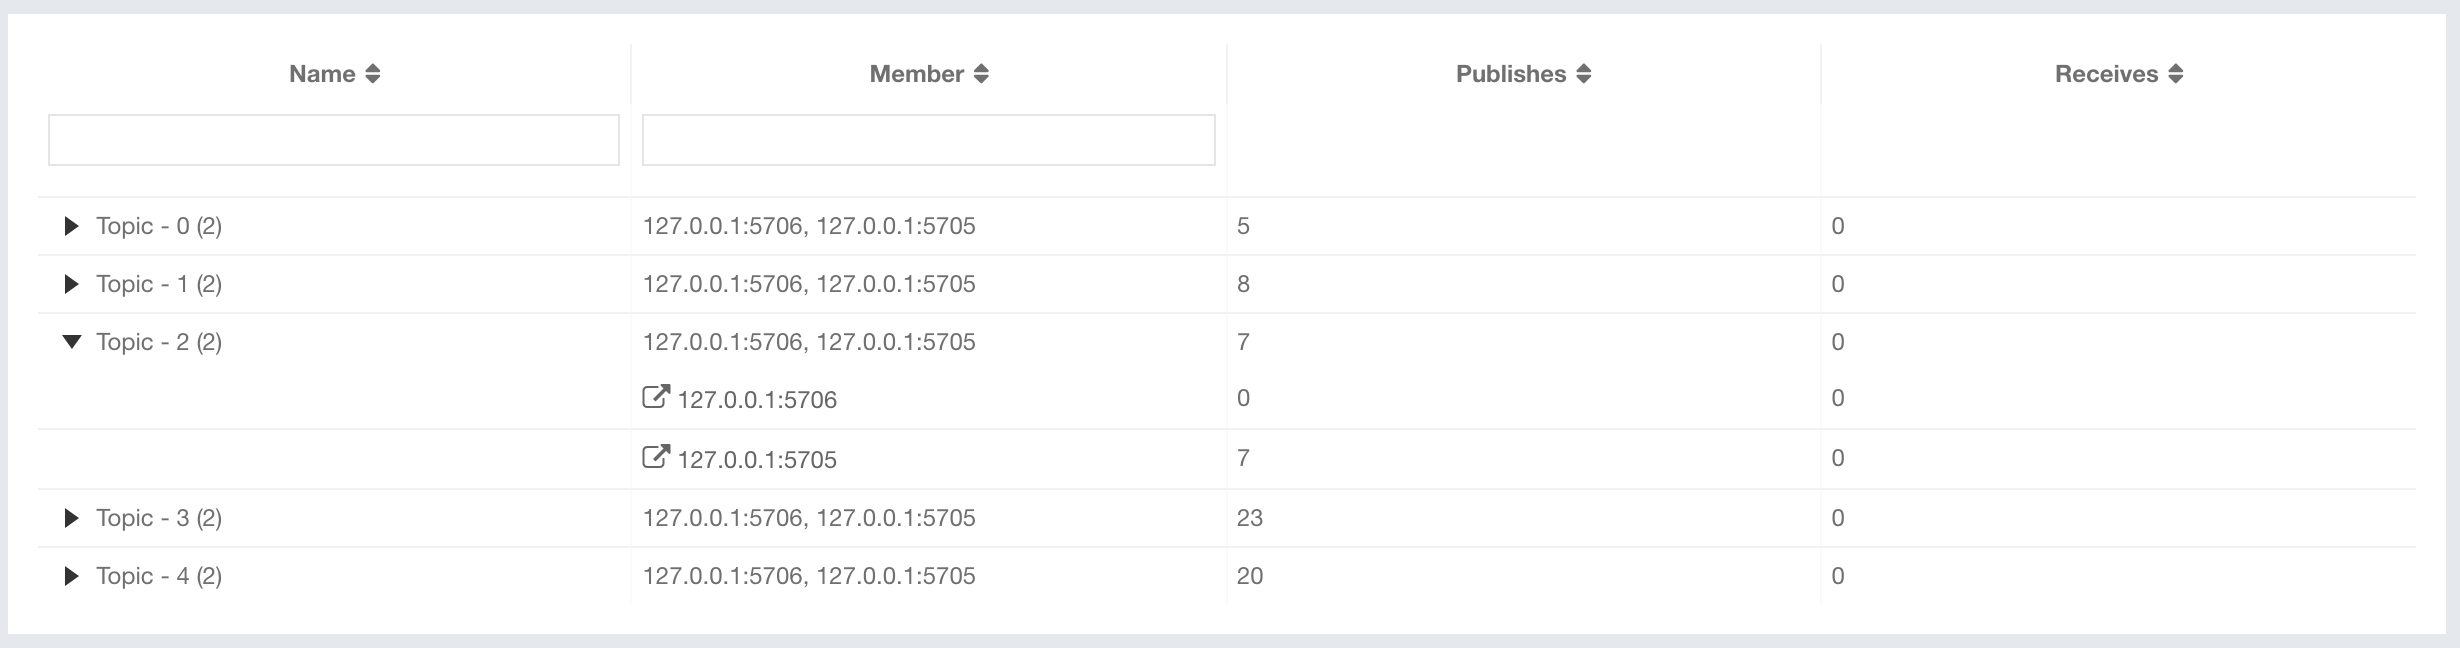
You can filter the topics shown and you can also sort the table by clicking on the column headers. Clicking on a topic name opens a new page for monitoring that topic instance on the right, as shown below.
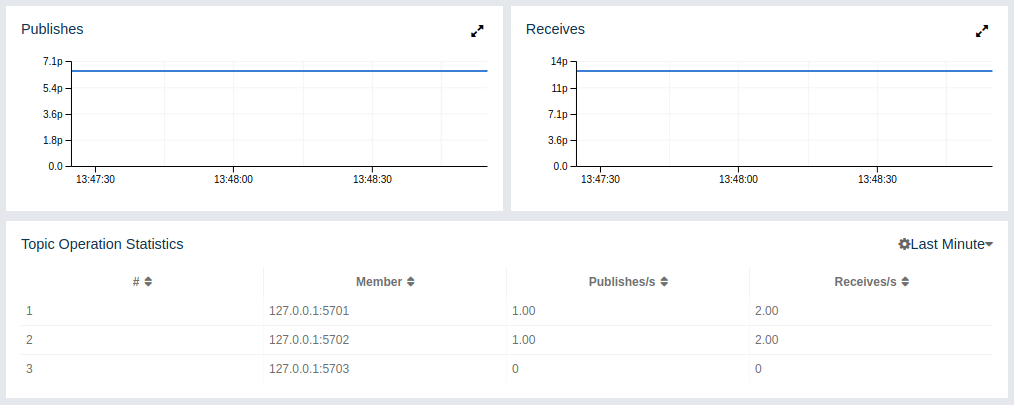
On top of the page, two charts monitor the Publishes and
Receives in real-time. They show the published and received
message counts of the cluster, the members of which are subscribed
to the selected topic. The X-axis of both charts show the current
system time. To open a chart as a separate dialog, click on the
button placed at the top right
of each chart.
Under these charts is the Topic Operation Statistics table. From left to right, this table lists the IP addresses and ports of each member, and counts of the messages published and received per second in real-time. You can select the period in the combo box placed at top right corner of the table to show the table data. The available values are Since Beginning, Last Minute, Last 10 Minutes and Last 1 Hour.
Click on the column heading to ascend or descend the order of the listings.
11.7. Reliable Topics
You can see a list of all the Reliable Topics in your cluster by clicking on the Reliable Topics menu item on the left panel. A new page is opened on the right, as shown below.
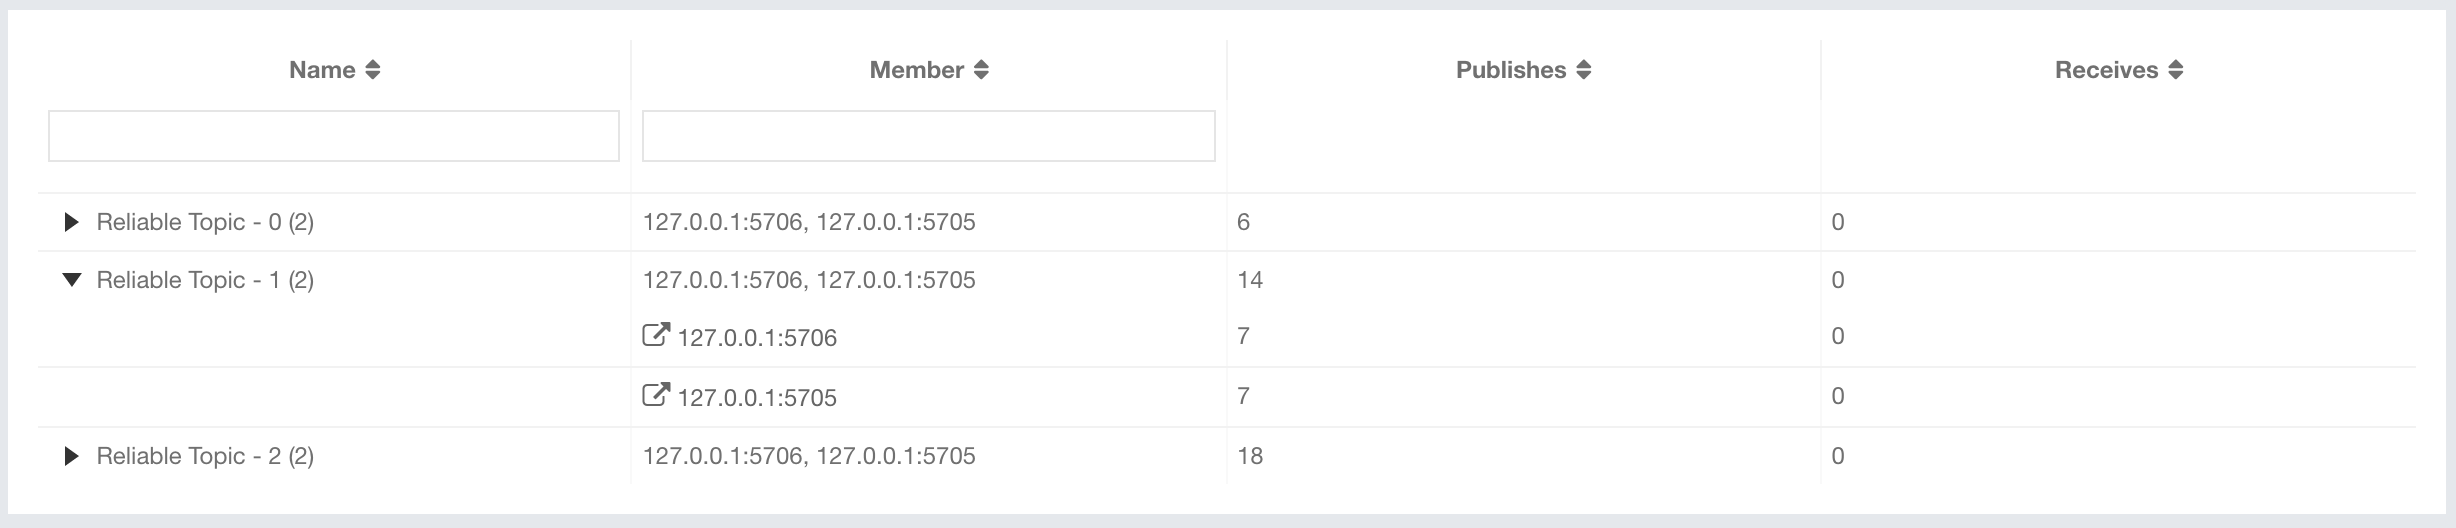
You can filter the Reliable Topics shown and you can also sort the table by clicking on the column headers. Clicking on a Reliable Topic name opens a new page for monitoring that Reliable Topic instance on the right, as shown below.
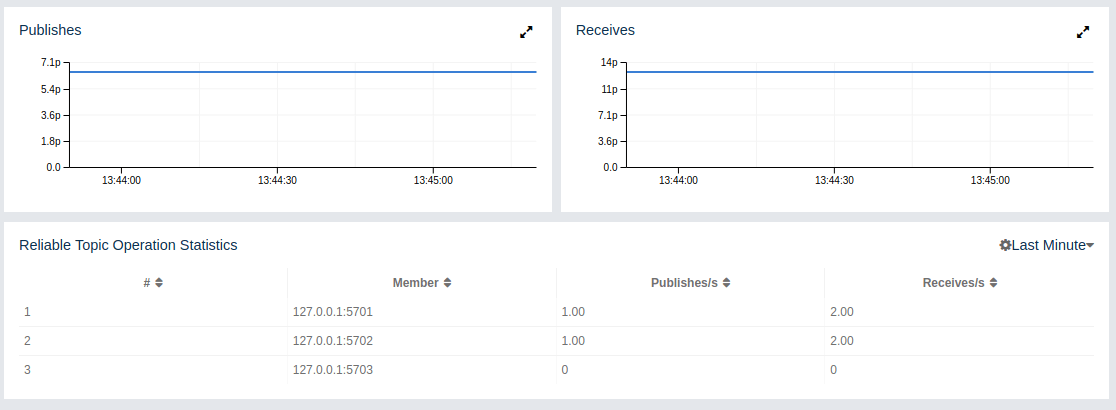
On top of the page, two charts monitor the Publishes and
Receives in real-time. They show the published and received
message counts of the cluster, the members of which are subscribed
to the selected reliable topic. The X-axis of both charts show
the current system time. To open a chart as a separate dialog,
click on the button placed at
the top right of each chart.
Under these charts is the Reliable Topic Operation Statistics table. From left to right, this table lists the IP addresses and ports of each member, and counts of the messages published and received per second in real-time. You can select the period in the combo box placed at top right corner of the table to show the table data. The available values are Since Beginning, Last Minute, Last 10 Minutes and Last 1 Hour.
Click on the column heading to ascend or descend the order of the listings.
11.8. Executors
You can see a list of all the Executors in your cluster by clicking on the Executors menu item on the left panel. A new page is opened on the right, as shown below.
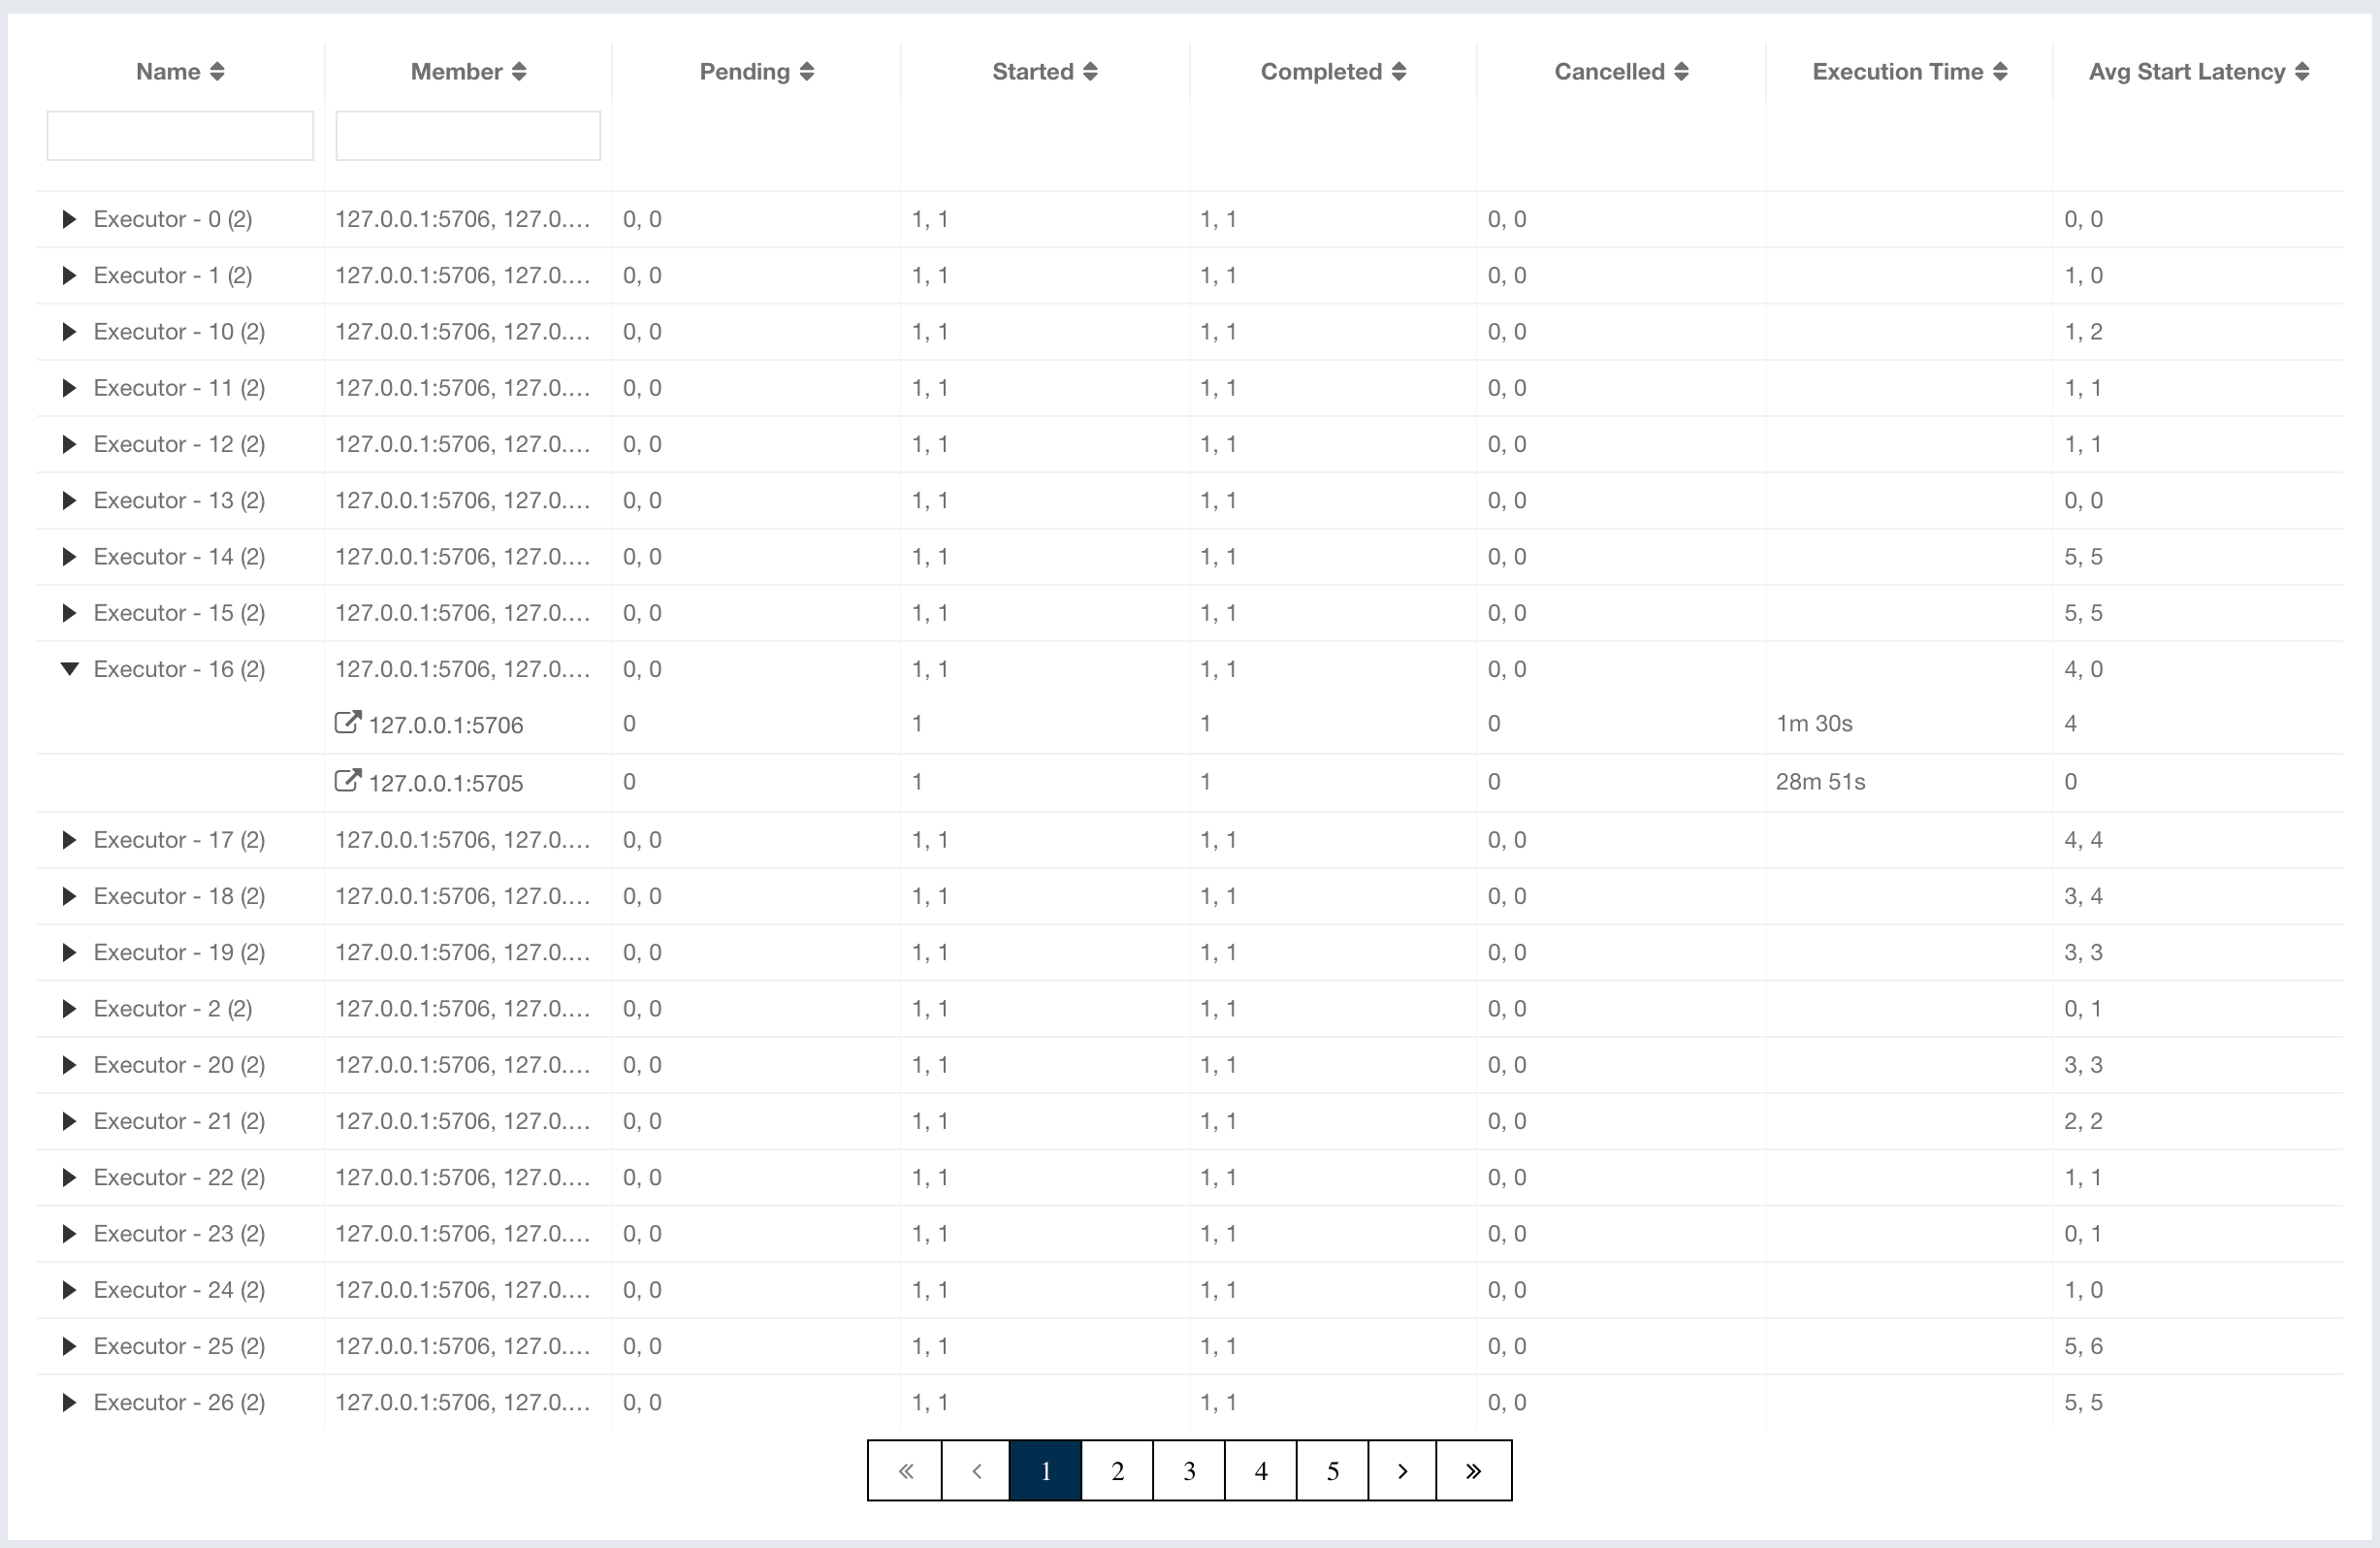
You can filter the Executors shown and you can also sort the table by clicking on the column headers. Clicking on an Executor name opens a new page for monitoring that Executor instance on the right, as shown below.
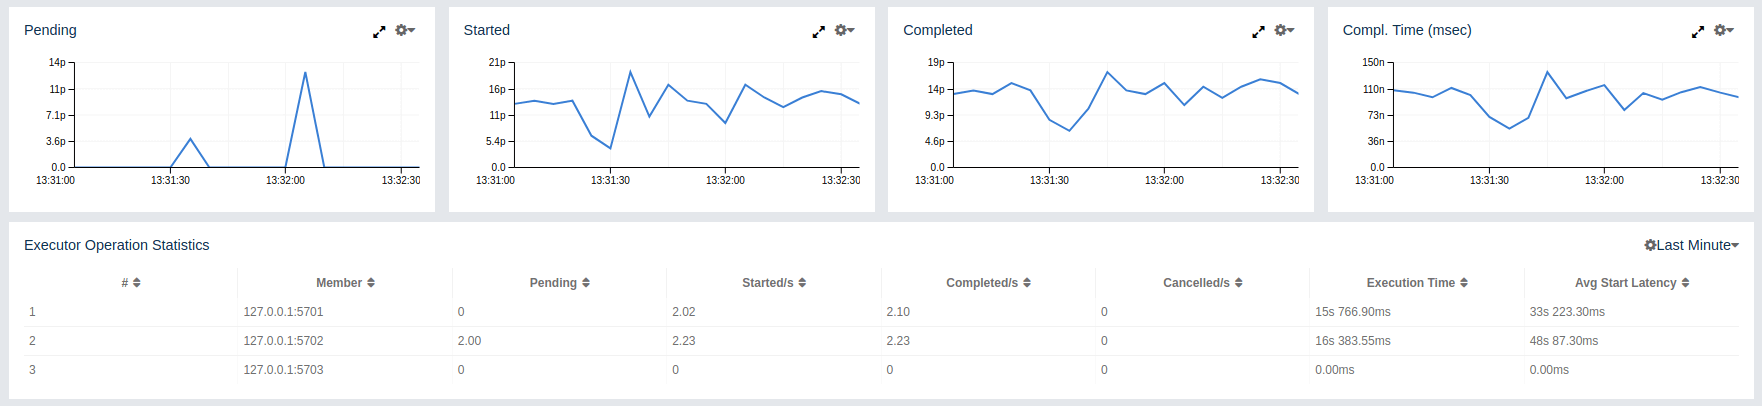
On top of the page, small charts monitor the pending, started,
completed, etc. executors in real-time. The X-axis of all the charts
shows the current system time. You can select other small monitoring
charts using the button
placed at the top right of each chart. Click the button to list the
monitoring options, as shown below.
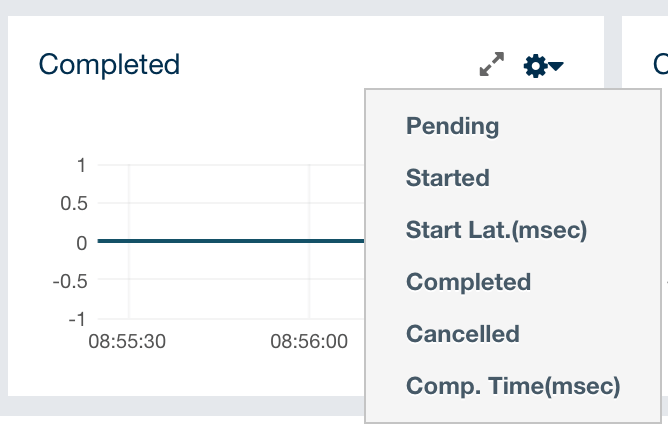
When you click on a desired monitoring, the chart loads with the
selected option. To open a chart as a separate dialog, click on the
button placed at top right of each
chart. The below monitoring charts are available:
-
Pending: Monitors the pending executors. Y-axis is the executor count.
-
Started: Monitors the started executors. Y-axis is the executor count.
-
Start Lat. (msec.): Shows the latency when executors are started. Y-axis is the duration in milliseconds.
-
Completed: Monitors the completed executors. Y-axis is the executor count.
-
Comp. Time (msec.): Shows the completion period of executors. Y-axis is the duration in milliseconds.
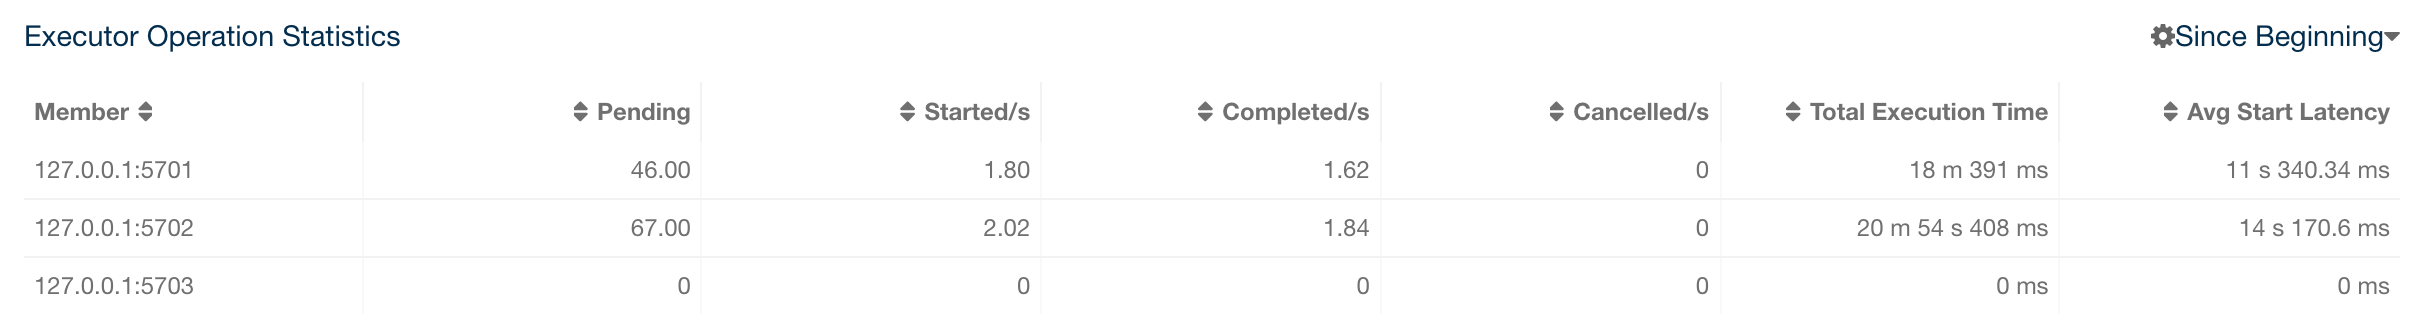
From left to right, this table lists the IP address and port of members, the counts of pending, started and completed executors per second, and the total execution time and average start latency of executors on each member. Click on the column heading to ascend or descend the order of the listings.
11.9. Locks
You can use the scripting feature of the Management Center to monitor the locks in your cluster. See the Scripting section to learn how to use this feature.
You can use the below scripts to retrieve various information about the locks in your cluster.
To find the number of active locks in your cluster, use the following script:
var findLocks = function() {
    var lockstr = '';
    var node = hazelcast.getCluster().getLocalMember();

    var locks = hazelcast.node.nodeEngine.getService('hz:impl:lockService').getAllLocks();
    return "Active Lock Count : " + locks.size();

}

findLocks();
To print the locks in your cluster, use the following script:
var findLocks = function() {
        var lockStr = '';
        var distributedObjects = hazelcast.getDistributedObjects();
        for each(distributedObject in distributedObjects) {
            if(distributedObject.getServiceName().equals("hz:impl:lockService")){
                lockStr += distributedObject.getName() + '\n';
            }

        }
        return lockStr;
}

findLocks();
To force unlock a lock in your cluster, use the following script:
var forceUnlock = function(lockName) {

    hazelcast.getLock(lockName).forceUnlock();
    return 'OK';

}

forceUnlock('your_Lock_Name');
To check if a lock is being hold by a member, use the following script:
var isLocked = function(lockName) {

    var locked = hazelcast.getLock(lockName).isLocked();
    return lockName + ' -> ' + locked;

}

isLocked('your_Lock_Name');
11.10. PN Counters
You can see a list of all the PN counters in your cluster by clicking on the Counters menu item on the left panel. A new page is opened on the right, as shown below.
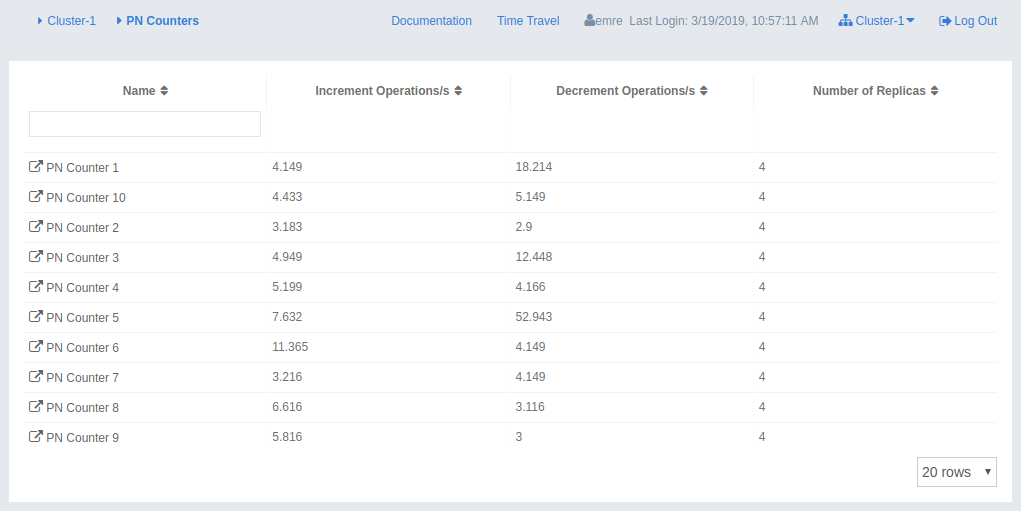
You can filter the counters shown and you can also sort the table by clicking on the column headers. The monitoring data available are:
-
Increment Operations/s: Average number of times the counter was incremented per second during the last timeslice.
-
Decrement Operations/s: Average number of times the counter was decremented per second during the last timeslice.
-
Number of Replicas: Number of member instances that have a state for the counter.
Clicking on a counter name opens a new page for monitoring that specific counter instance, as shown below.
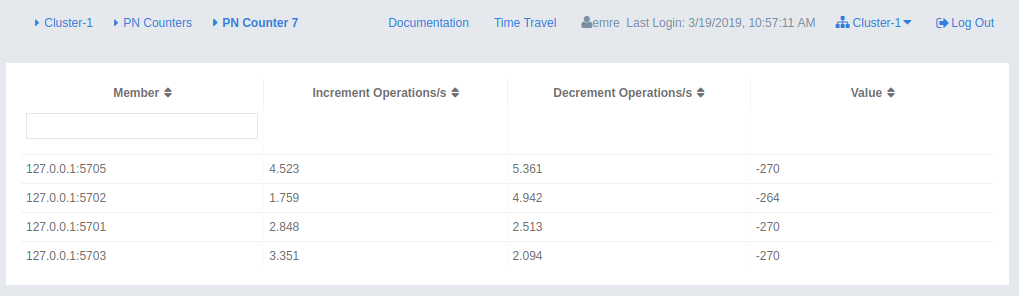
The table can likewise be sorted by clicking the column headers. It shows IP and port of the members that have a state for the specific counter named in the page’s title. The monitoring data available are:
-
Increment Operations/s: Average number of times the counter was incremented on that member per second during the last timeslice
-
Decrement Operations/s: Average number of times the counter was decremented on that member per second during the last timeslice
-
Value: Current value of the counter on that member.
11.11. Flake ID Generators
You can see a list of all Flake ID Generators in your cluster by clicking on the ID Generators menu item on the left panel. A new page is opened on the right, as shown below.
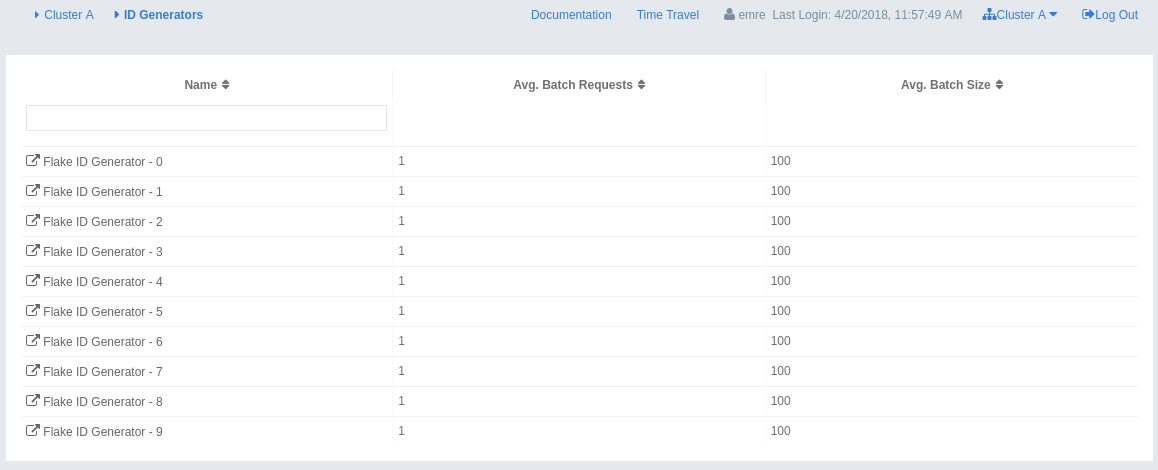
You can filter the generators shown and you can also sort the table by clicking on the column headers. The monitoring data available are:
-
Avg. Batch Requests: Average count of batch requests coming from all the members to a generator, i.e., total batch requests from all members to a generator divided by the member count for that generator.
-
Avg. Batch Size: Average size of the ID batches created by a generator, i.e., total number of IDs generated (the sum of IDs for all batches) for all members divided by the total count of batch requests coming from all members.
Clicking on a generator name opens a new page for monitoring that specific generator instance, as shown below.
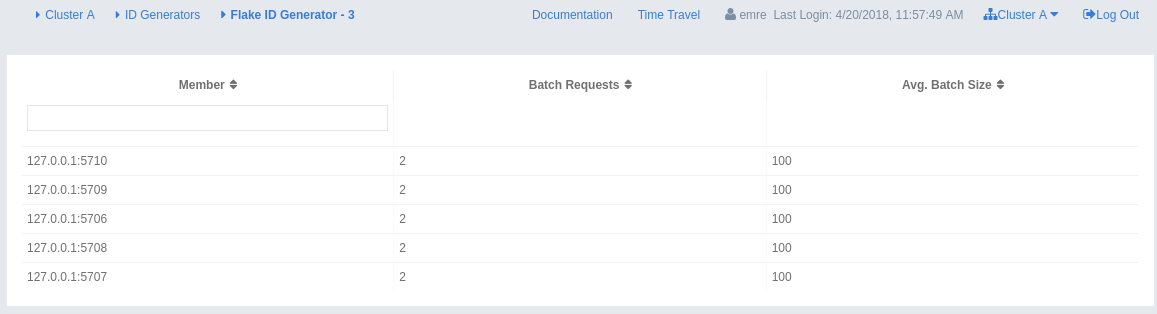
The table can likewise be sorted by clicking the column headers. It shows IP and port of the members that have a state for the specific generator named in the page’s title. The monitoring data available are:
-
Batch Requests: Total count of batch requests to a generator by this member.
-
Avg. Batch Size: Average size of the ID batches created for this member, i.e., total number of IDs generated (the sum of IDs for all batches) for this member divided by the total count of batch requests coming from this member.
| The operations per second is not the number of new IDs generated or used but the number of ID batches. The batch size is configurable, usually it contains hundreds or thousands of IDs. A client uses all IDs from a batch before a new batch is requested. |
12. Monitoring WAN Replication
WAN replication schemes are listed under the WAN Replication menu item on the left. When you click on a scheme, a new page for monitoring the targets which that scheme has appears on the right, as shown below:
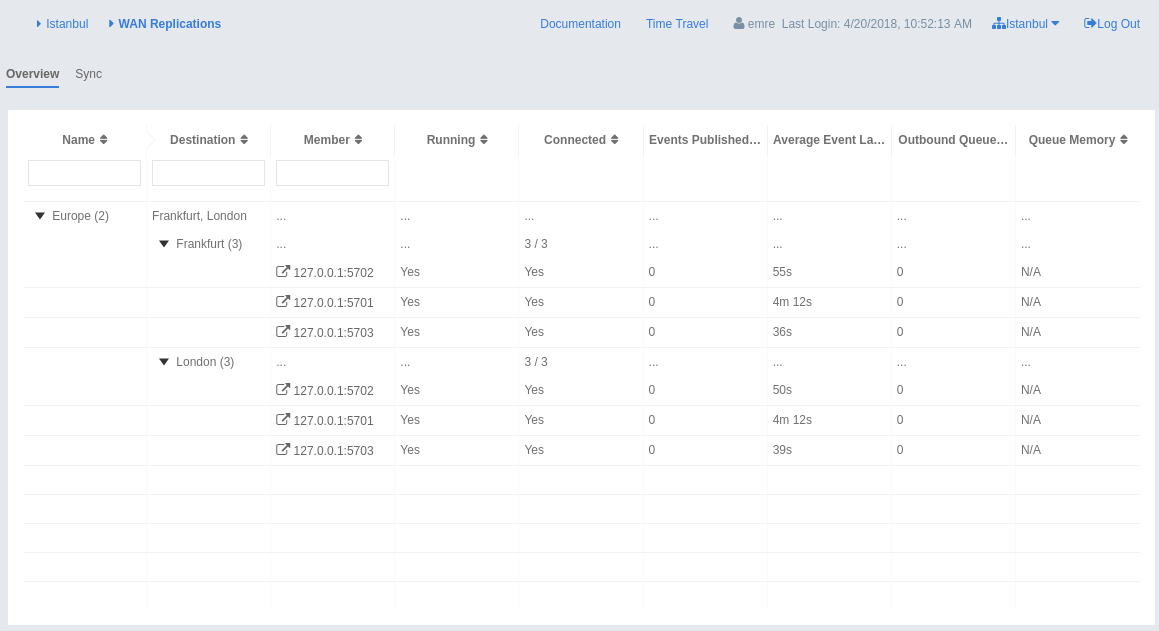
In this page, you see the WAN Replication Operations Table for each target which belongs to this scheme. One of the example tables is shown below:
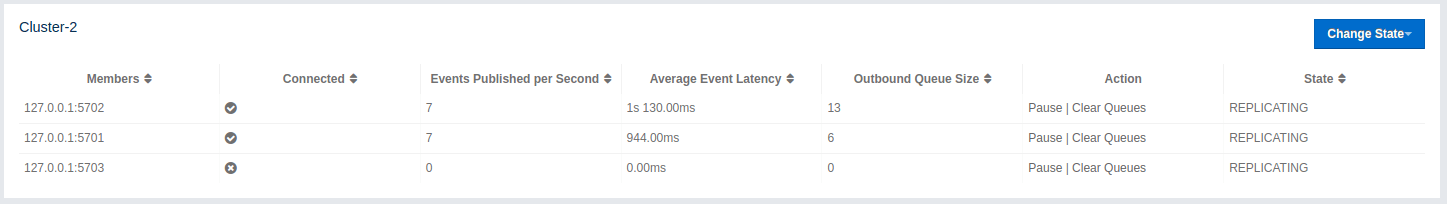
-
Connected: Status of the member connection to the target.
-
Events Published per Second: Number of published events per second. Please see the paragraph below.
-
Average Event Latency: Average latency of sending a record to the target from this member. Please see the paragraph below.
-
Outbound Queue Size: Number of records waiting in the queue to be sent to the target.
-
Action: Pause, stop or resume replication of a member’s records. You can also clear the event queues in a member using the "Clear Queues" action. For instance, if you know that the target cluster is being shut down, decommissioned, put out of use and it will never come back, you may additionally clear the WAN queues to release the consumed heap after the publisher has been switched. Or, when a failure happens and queues are not replicated anymore, you could manually clear the queues using, again the "Clear Queues" action.
-
State: Shows current state of the WAN publisher on a member. See Changing WAN Publisher State for the list of possible WAN publisher states.
Events Published per Second and Average Event Latency are based on the following internal statistics:
-
Total published event count (TBEC): Total number of events that are successfully sent to the target cluster since the start-up of the member.
-
Total latency (TL): Grand total of each event’s waiting time in the queue, including network transmit and receiving ACK from the target.
Each member sends these two statistics to the Management Center at intervals of 3 seconds (update interval). Management Center derives Events Published per Second and Average Event Latency from these statistics as formulated below:
Events Published per Second = (Current TBEC - Previous TBEC) / Update Interval
Average Event Latency = (Current TL - Previous TL) / (Current TBEC - Previous TBEC)
12.1. Changing WAN Publisher State
A WAN publisher can be in one of the following states:
-
REPLICATING(default): State where both enqueuing new events is allowed, enqueued events are replicated to the target cluster. -
PAUSED: State where new events are enqueued but they are dequeued. Some events which have been dequeued before the state was switched may still be replicated to the target cluster but further events will not be replicated. -
STOPPED: State where neither new events are enqueued nor dequeued. As with thePAUSEDstate, some events might still be replicated after the publisher has switched to this state.
You can change a WAN publisher’s state by clicking the Change State
dropdown button on top right hand corner of
the WAN Replication Operations Table.
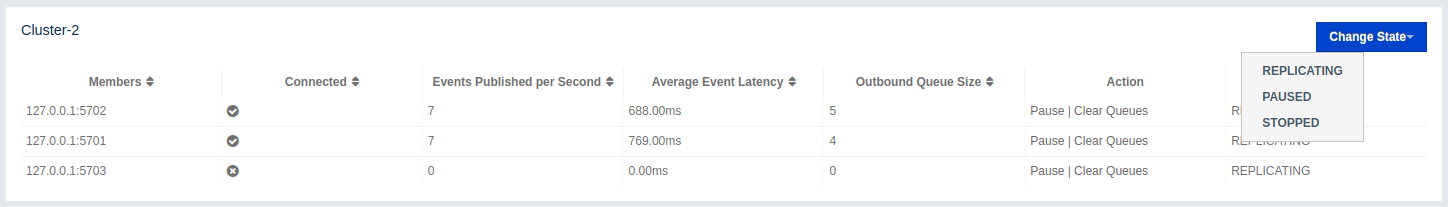
12.2. WAN Sync
You can initiate a synchronization operation on an IMap for a specific target cluster. This operation is useful if two remote clusters lost their synchronization due to WAN queue overflow or in restart scenarios.
Hazelcast provides the following synchronization options:
-
Default WAN synchronization operation: It sends all the data of an IMap to a target cluster to align the state of target IMap with the source IMap. See here for more information.
-
WAN synchronization using Merkle trees: To initiate this type of synchronization, you need to configure the cluster members. See the Delta WAN Synchronization section in Hazelcast IMDG Reference Manual for details about configuring them. Make sure you meet all the requirements to use Delta WAN Synchronization and do the configuration on both the source and target clusters.
To initiate WAN Sync, open the WAN Replication menu item on the left and navigate to the Sync tab.
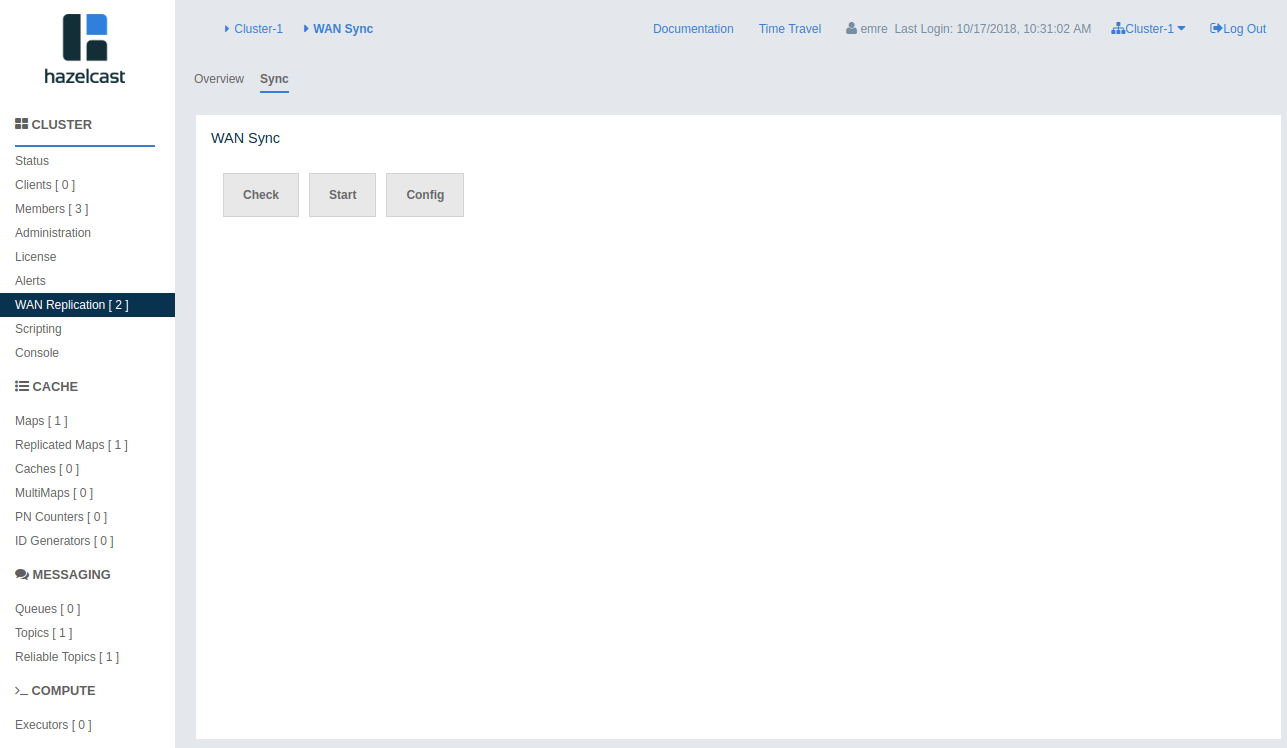
Click Start button to open the dialog, enter the target details for the sync operation and click Sync to start the operation.
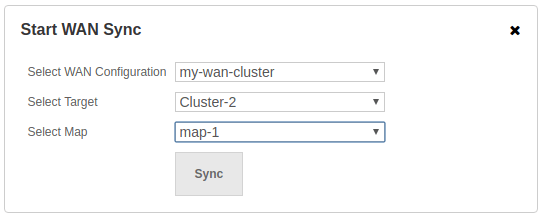
You can also use the "All Maps" option in the above dialog if you want to synchronize all the maps in source and target cluster.
You can see the progress of the operation once you initiate it.
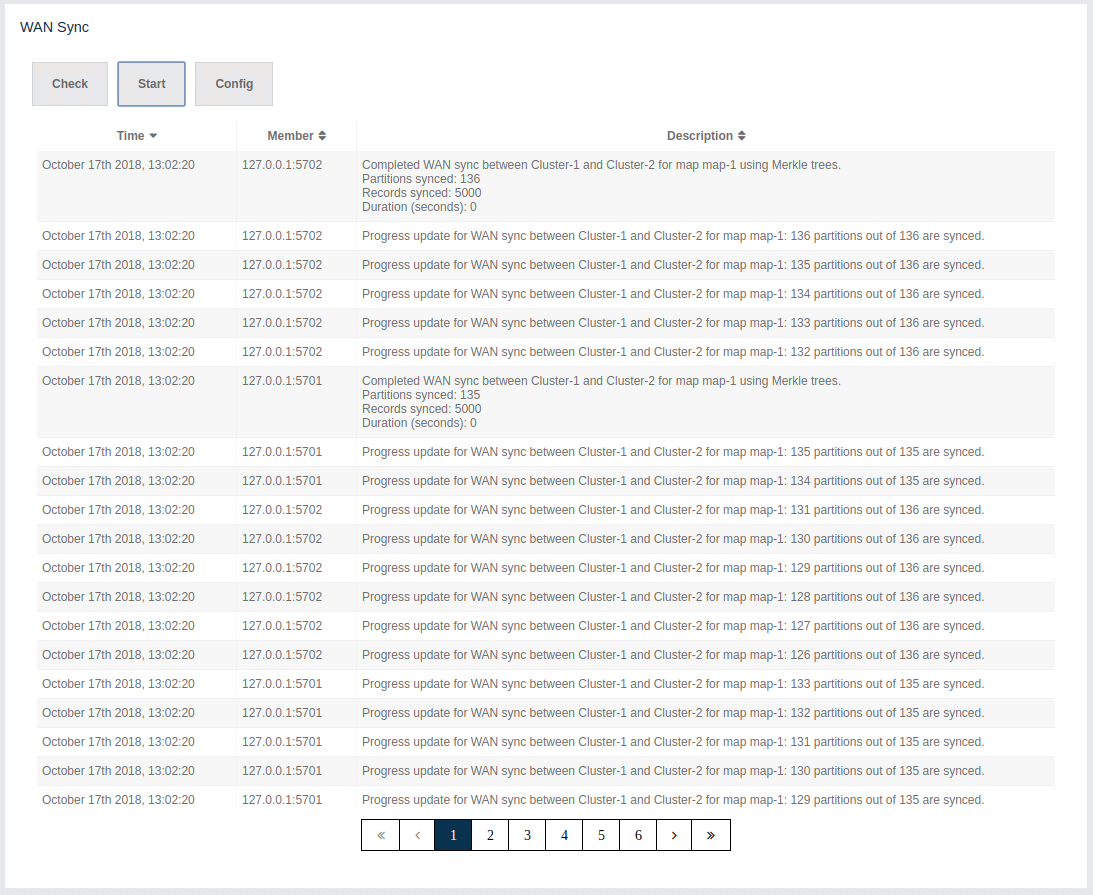
12.3. WAN Consistency Check
You can check if an IMap is in sync with a specific target cluster. Click Check button to open the dialog, enter the target details for the consistency check operation and click Check Consistency to start the operation.
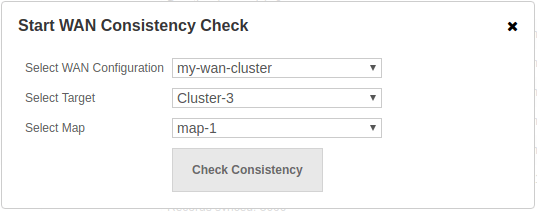
You can see the progress of the operation once you initiate it.
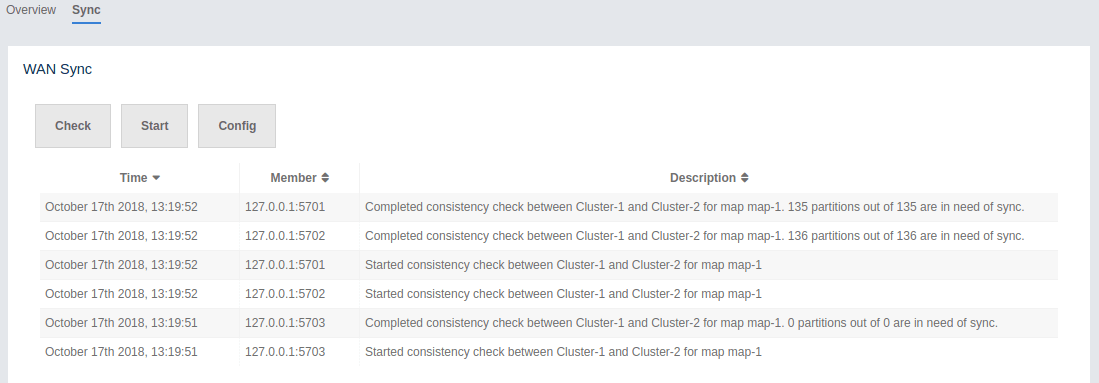
| You need to use Merkle trees for WAN synchronization to be able to check for the consistency between two clusters. You need to configure the Merkle trees on both the source and target clusters. If you do not configure it for the source cluster, consistency check is ignored. If it’s enabled for the source cluster but not for the target cluster, all entries are reported as if they need a sync because a sync operation will be a full sync in the absence of Merkle trees. |
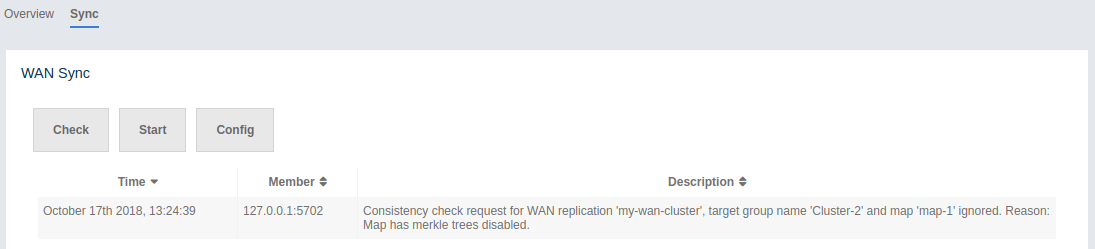
12.4. Add Temporary WAN Replication Configuration
You can add a temporary WAN replication configuration dynamically to a cluster. It is useful for having one-off WAN sync operations. The added configuration has two caveats:
-
It is not persistent, so it does not survive a member restart.
-
It cannot be used as a target for regular WAN replication. It can only be used for WAN sync.
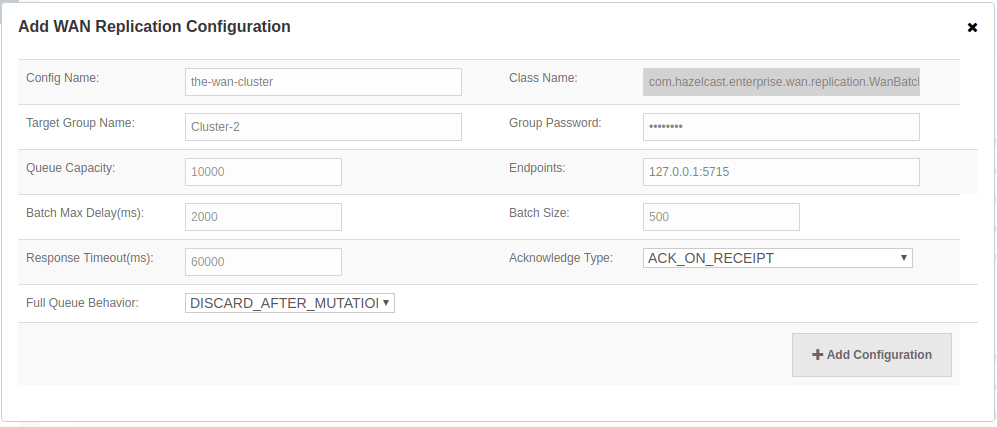
See the WAN Replication section in Hazelcast IMDG Reference Manual for details about the fields and their possible values.
After clicking the Add Configuration button, the new WAN replication configuration is added to the cluster. You can see the new configuration when you try to initiate a WAN sync operation as described in the previous section.
13. Scripting
You can use the scripting feature of the Management Center to execute codes on the cluster. To use this feature, click on the Scripting menu item on the left panel. Once selected, the scripting feature opens as shown below.
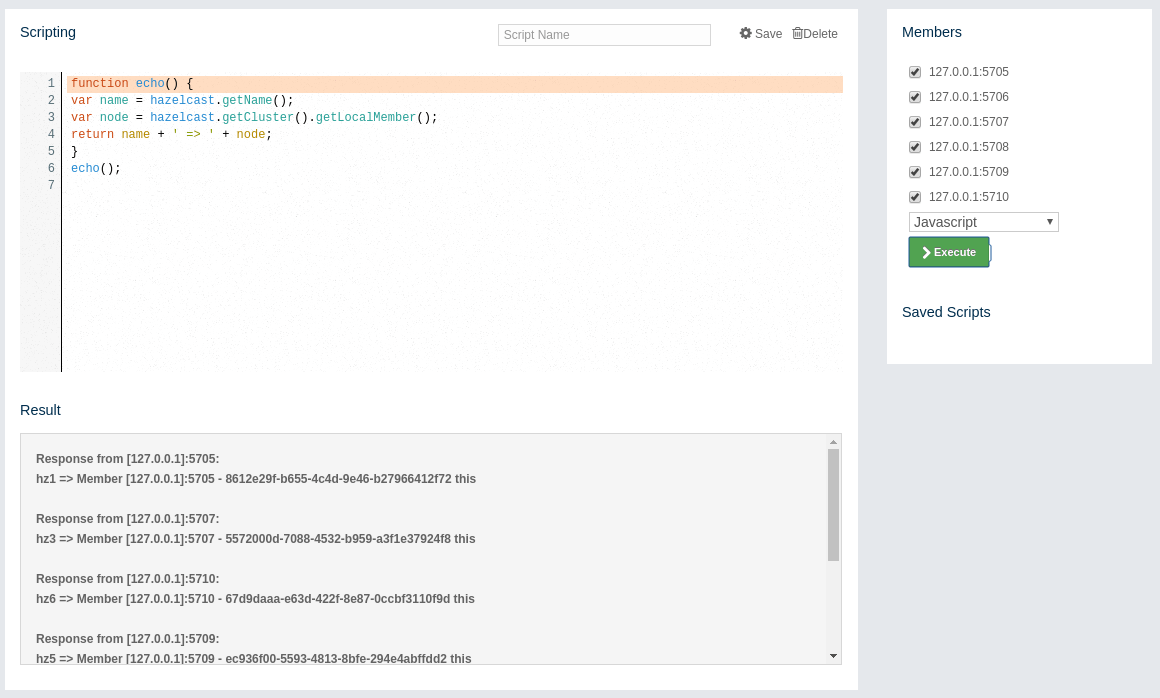
In this window, the Scripting part is the actual coding editor. You can select the members on which the code will execute from the Members list shown at the right side of the window. Below the members list, a combo box enables you to select a scripting language: currently, JavaScript, Ruby, Groovy and Python languages are supported. After you write your script and press the Execute button, you can see the execution result in the Result part of the window.
| To use the scripting languages other than JavaScript on a member, the libraries for those languages should be placed in the classpath of that member. |
There are Save and Delete buttons on the top right of the scripting editor. To save your scripts, press the Save button after you type a name for your script into the field next to this button. The scripts you saved are listed in the Saved Scripts part of the window, located at the bottom right of the page. Click on a saved script from this list to execute or edit it. If you want to remove a script that you wrote and saved before, select it from this list and press the Delete button.
In the scripting engine you have a HazelcastInstance bonded to a variable
named hazelcast. You can invoke any method that HazelcastInstance has via
the hazelcast variable. You can see an example usage for JavaScript below:
var name = hazelcast.getName();
var node = hazelcast.getCluster().getLocalMember();
var employees = hazelcast.getMap("employees");
employees.put("1","John Doe");
employees.get("1"); // will return "John Doe"| Starting with Hazelcast 3.11.1, you have the option to disable scripting on the Hazelcast members. The support for script execution is enabled in the Hazelcast IMDG Open Source edition and disabled in the Hazelcast IMDG Enterprise edition by default. Members list shows whether scripting is enabled or disabled for each member. Please see the Toggle Scripting Support section in the Hazelcast IMDG Reference Manual for details. |
14. Executing Console Commands
The Management Center has a console feature that enables you to
execute commands on the cluster. For example, you can perform
puts and gets on a map, after you set the namespace with
the command ns <name of your map>. The same is valid for queues,
topics and other data structures that can be monitored on the Management
Center. To execute your command, type it into the field below the console
and press Enter. Type help to see all the commands that you can use.
Open a console window by clicking on the Console button located on
the left panel. Below is a sample view with the help command executed.
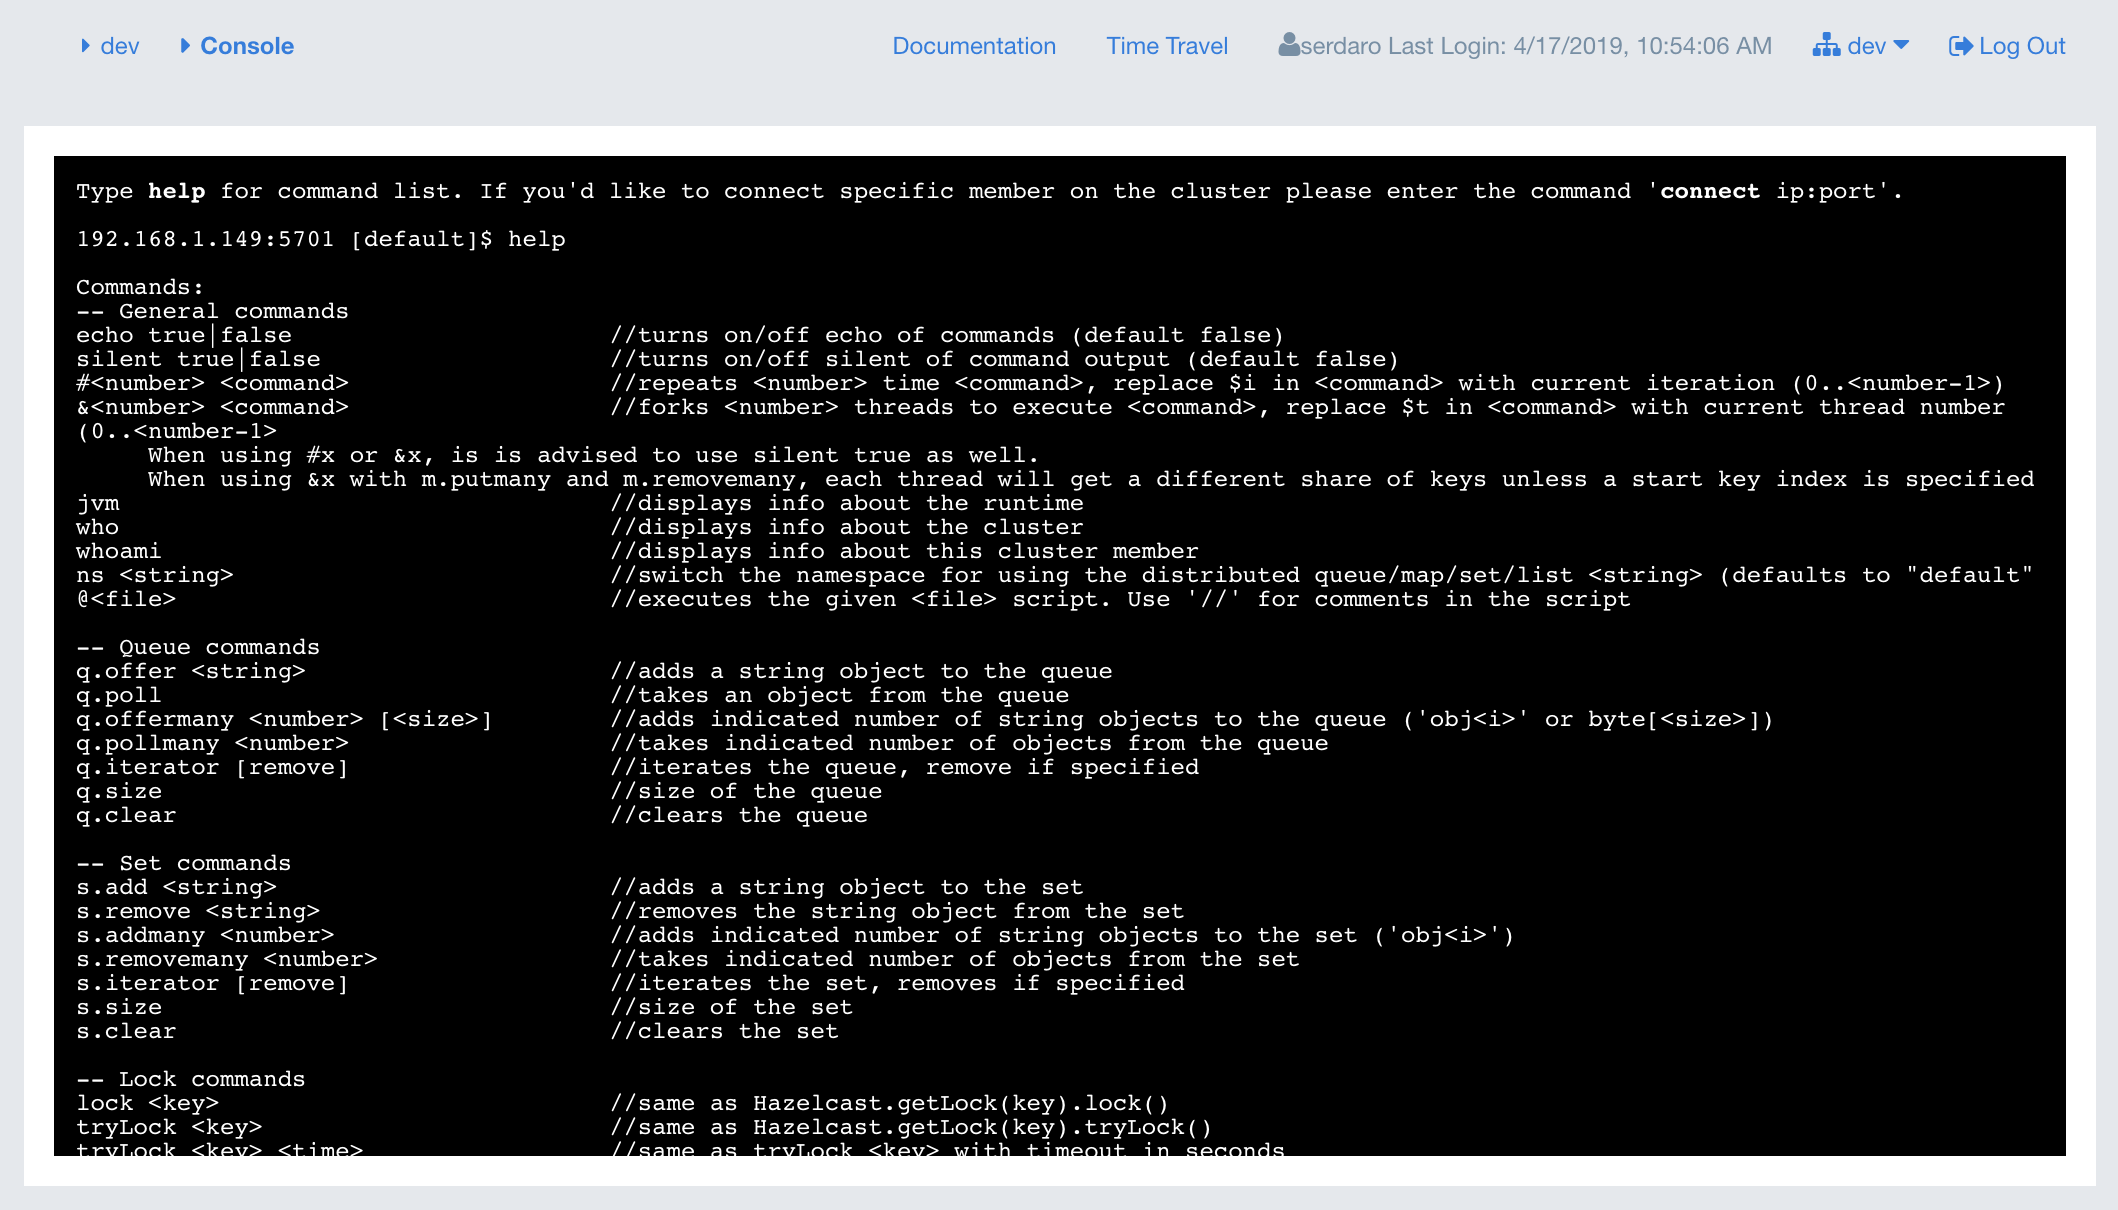
The Management Center sends commands to one of the cluster members; for this, it makes an HTTP request to the REST endpoint on that member. As you can see in the above screenshot, the console screen shows the IP address of the member which receives the console commands. Basically, it connects to the port that member listens to, which is configured on the member side as described here. An example configuration on the member side is shown below:
<hazelcast>
    ...
    <network>
        <port port-count="20" auto-increment="true">5701</port>
    </network>
    ...
</hazelcast>
The direction of this communication is from an ephemeral port number on the Management Center to the port number 5701 (according to the above example) on the member.
| There is no configuration option to specify which outbound ports the Management Center will use; it picks on from the ephemeral port pool. Note that, this can create an issue where a firewall is placed between the cluster and Management Center. |
15. Creating Alerts
You can use the alerts feature of the Management Center to receive alerts and/or email notifications by creating filters. In these filters, you can specify various criteria for the cluster members or data structures. When the specified criteria are met for a filter, the related alert is shown as a pop-up message on the top right of the page or sent as an email.
Once you click on the Alerts button located on the left panel, the page shown below appears.
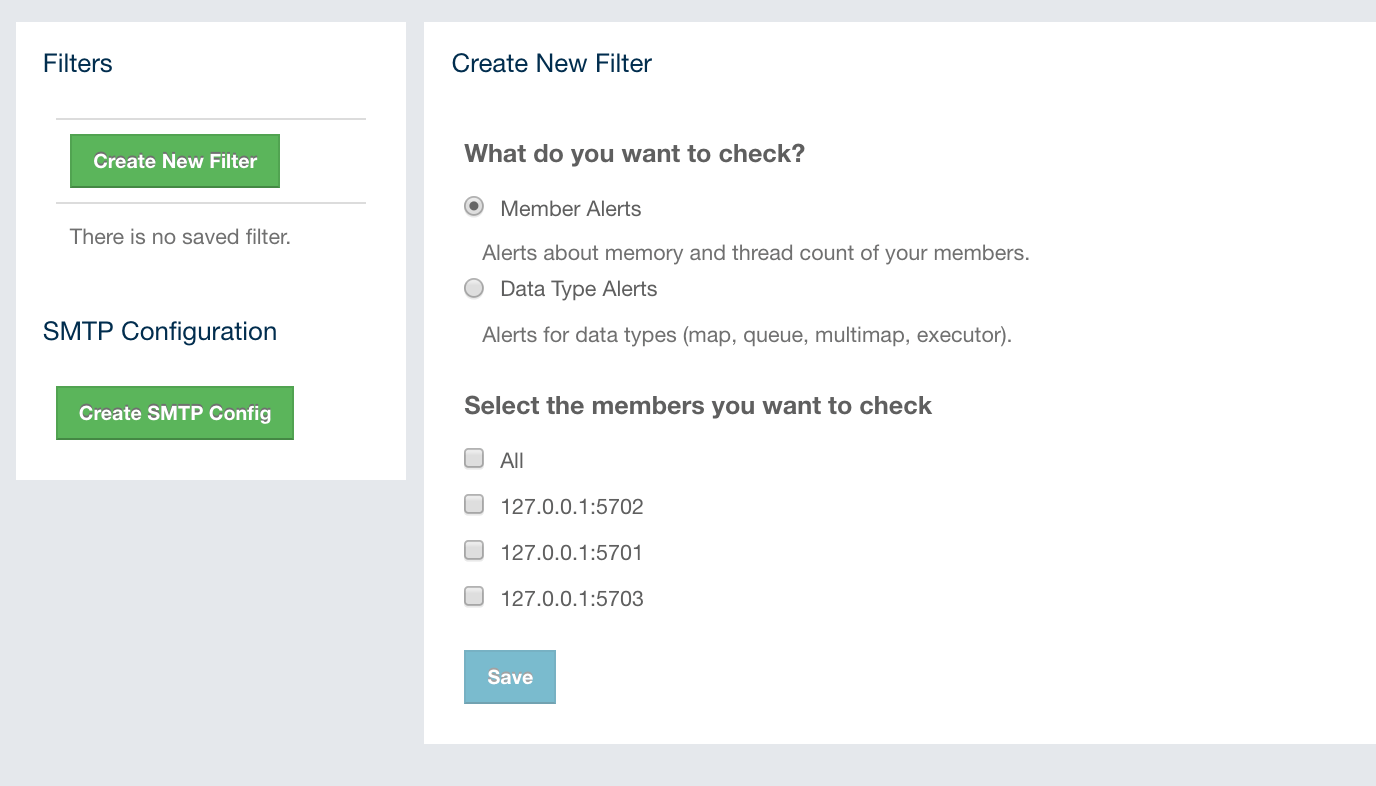
If you want to enable the Management Center to send email notifications to its admin users, you need to configure the SMTP server. To do this, click on the Create STMP Config button shown above. The form shown below appears.
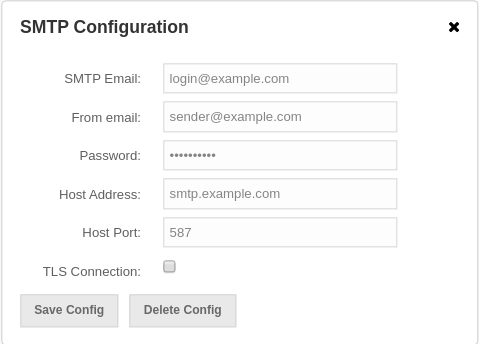
In this form, specify the email address from which the notifications will be sent and also its password. You can set a separate SMTP email for authenticating with the server and a "From" email which will be used as the sender email of the outgoing notifications, if these are different (if they are the same, then you can leave the "From" email empty).
Then, provide the SMTP server host address and port. Finally, check the TLS Connection checkbox if the connection is secured by TLS (Transport Layer Security).
After you provide the required information, click on the Save Config button. After a processing period (for a couple of seconds), the form closes if the configuration is created successfully. In this case, an email is sent to the email address you provided in the form stating that the SMTP configuration is successful and the email alert system is created.
If not, you will see an error message at the bottom of this form as shown below.
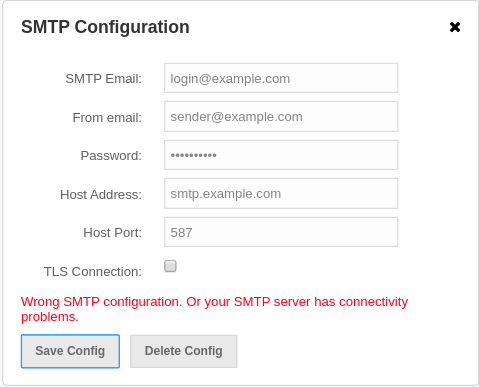
As you can see, the reasons can be incorrect SMTP configuration or connectivity problems. In this case, check the form fields and any causes for the connection issues with your server.
15.1. Creating Filters for Cluster Members
Select the Member Alerts check box to create filters for some or all members in the cluster. Once selected, the next screen asks for which members the alert will be created. Select the desired members and click on the Next button. On the next page (shown below), specify the criteria.
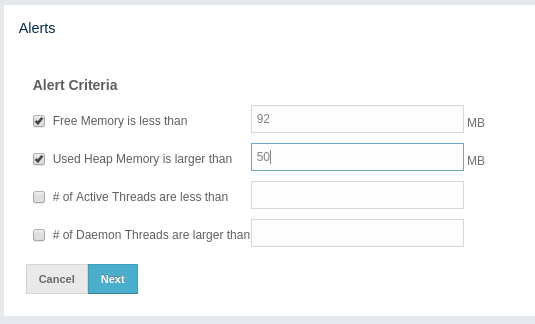
You can create alerts when:
-
free memory on the selected members is less than the specified number
-
used heap memory is larger than the specified number
-
the number of active threads are less than the specified count
-
the number of daemon threads are larger than the specified count.
When two or more criteria is specified they will be bound with the logical operator AND.
On the next page, give a name for the filter. Then, select whether the notification emails will be sent to the Management Center Admins using the Send Email Alert checkbox. Then, provide a time interval (in seconds) for which the emails with the same notification content will be sent using the Email Interval (secs) field. Finally, select whether the alert data will be written to the disk (if checked, you can see the alert log in the directory /users/<your user>/hazelcast-mc).
Click on the Save button; your filter will be saved and put into the Filters
part of the page. To edit the filter, click on the  icon. To
delete it, click on the
icon. To
delete it, click on the  icon.
icon.
15.2. Creating Filters for Data Types
Select the Data Type Alerts check box to create filters for data structures. The next screen asks for which data structure (maps, queues, multimaps, executors) the alert will be created. Once a structure is selected, the next screen immediately loads and asks you to select the data structure instances, e.g., if you selected Maps, it lists all the maps defined in the cluster; you can select one or more maps. Select as desired, click on the Next button, and select the members on which the selected data structure instances will run.
The next screen, as shown below, is the one where you specify the criteria for the selected data structure.
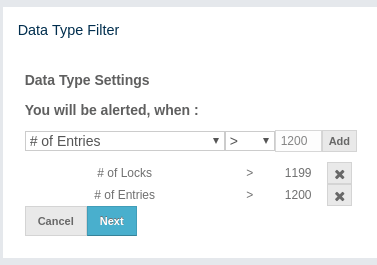
As the screen shown above shows, you will select an item from the left combo box, select the operator in the middle one, specify a value in the input field, and click on the Add button. You can create more than one criteria in this page; those will be bound by the logical operator AND.
After you specify the criteria, click on the Next button. On the next page, give a name for the filter. Then, select whether the notification emails will be sent to the Management Center Admins using the Send Email Alert checkbox. Then, provide a time interval (in seconds) for which the emails with the same notification content will be sent using the Email Interval (secs) field. Finally, select whether the alert data will be written to the disk (if checked, you can see the alert log in the directory /users/<your user>/hazelcast-mc).
Click on the Save button; your filter will be saved and put into the Filters
part of the page. To edit the filter, click on the icon.
To delete it, click on the icon.
15.3. Troubleshooting
In case the email notifications do not arrive, you can turn on verbose logging by
passing the -Dhazelcast.mc.mail.debug=true command line parameter. Note that the
email debugging output is written into stdout directly, bypassing Logback logger.
16. Administering the Cluster
Using the "Administration" menu item, you can change the state of your cluster, shut down it, update your Management Center license, add or edit users, and perform Rolling Upgrade or Hot Restart on your cluster. You can also update the URL of your Management Center, in case it is changed for any reason.
When you click on the "Administration" menu item, the following page shows up:
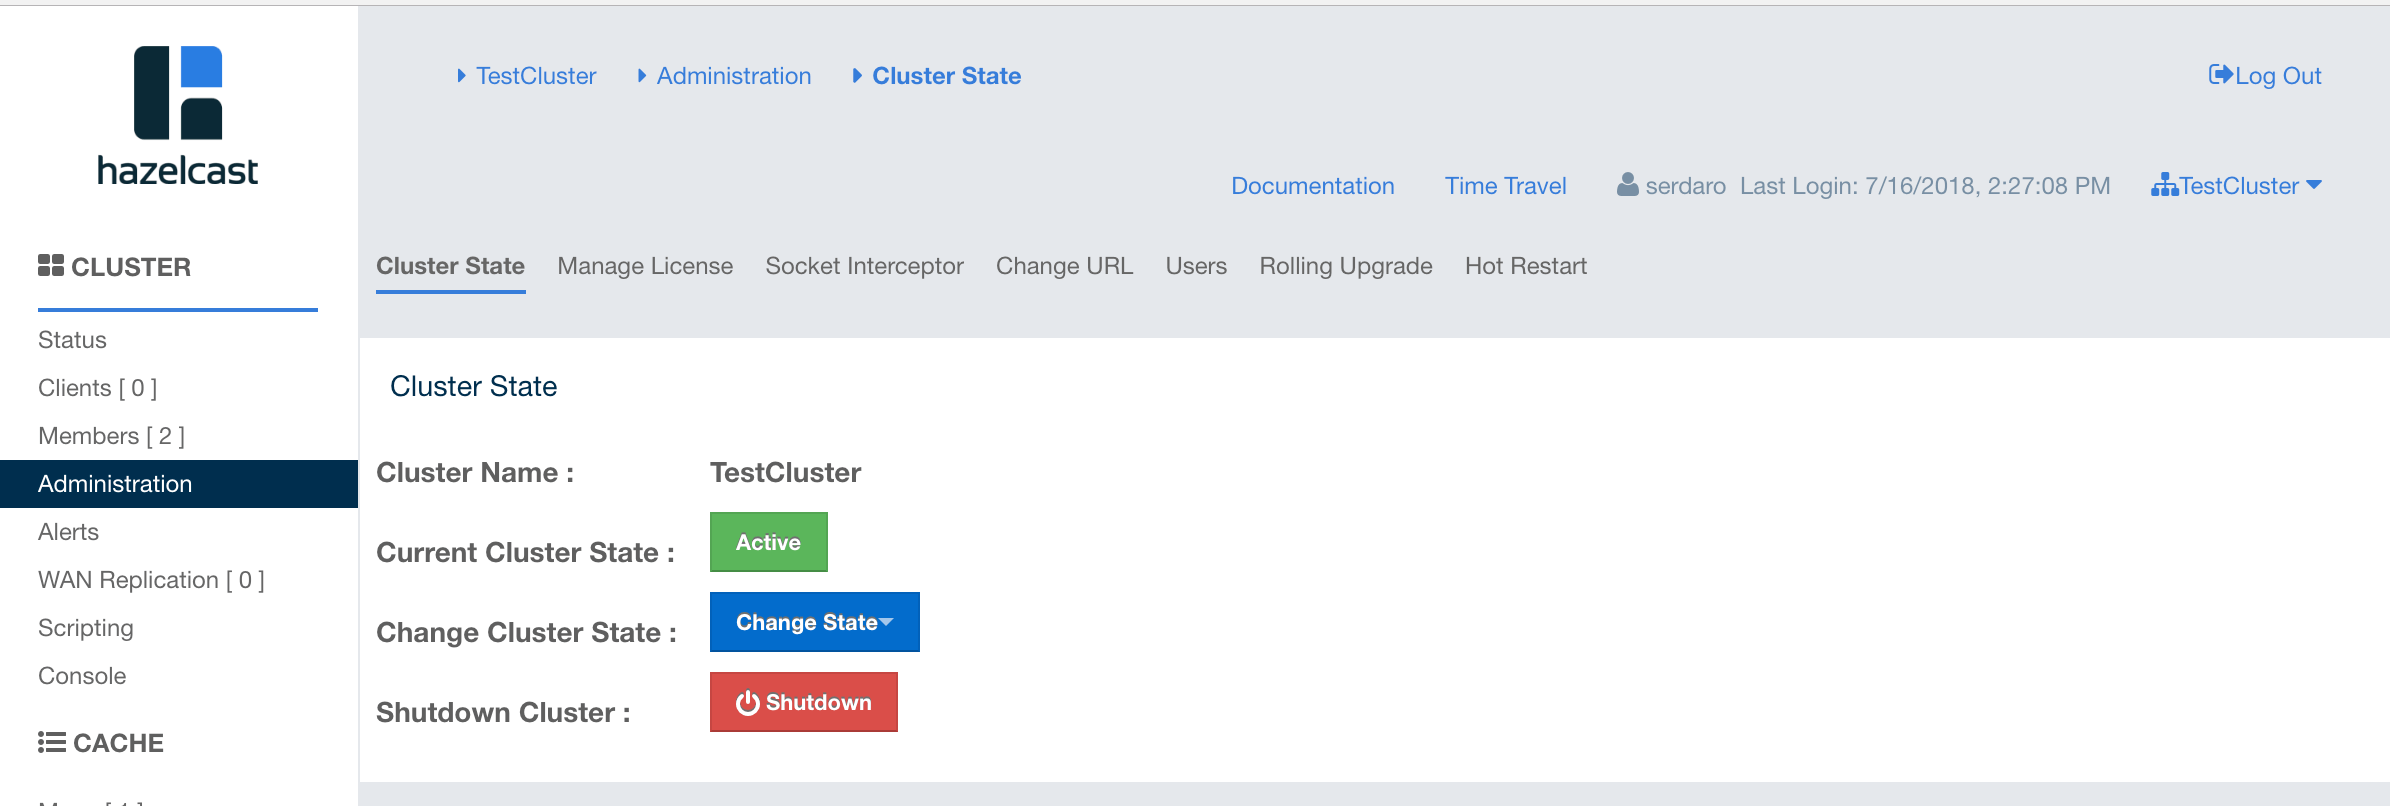
| This menu item is available only to admin users. |
You can perform the aforementioned administrative tasks using the tabs on this page. Below sections explain each tab.
16.1. Cluster State
The admin user can see and change the cluster state and shut down the cluster using the buttons listed in this page as shown below.
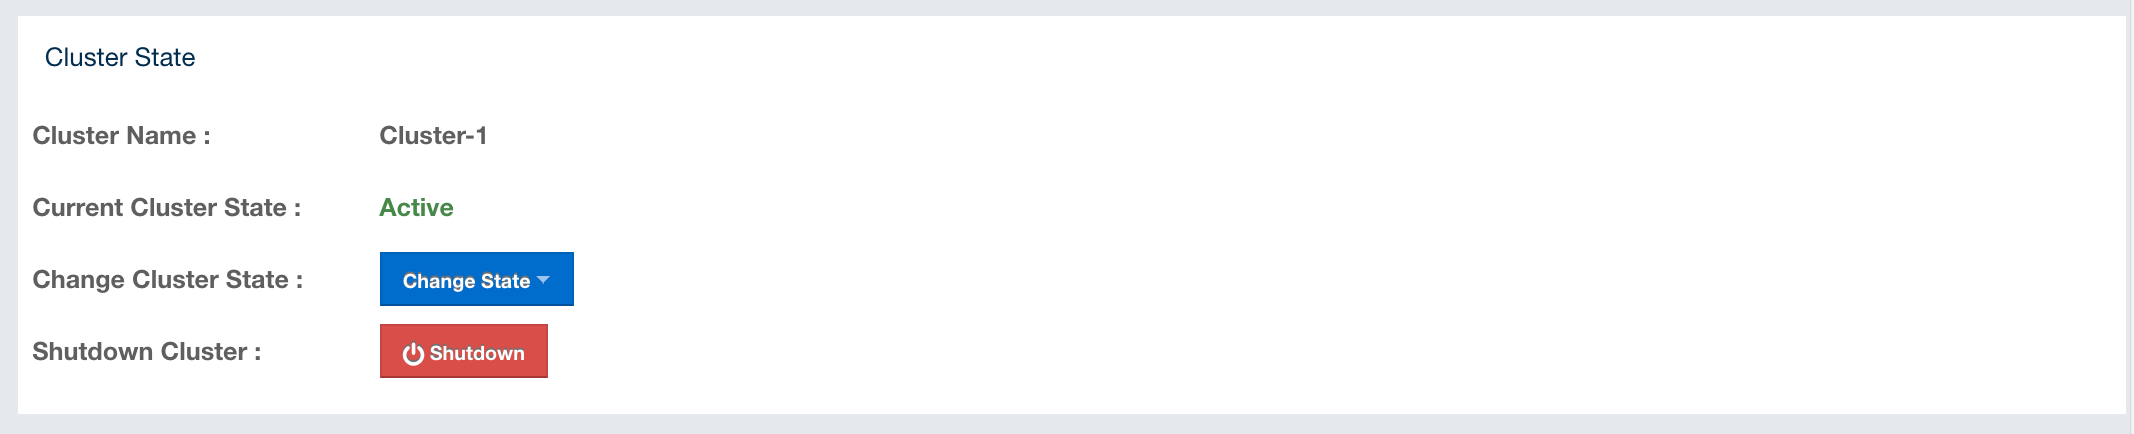
Cluster States:
-
Active: The cluster continues to operate without any restriction. All operations are allowed. This is the default state of a cluster.
-
No Migration: Migrations (partition rebalancing) and backup replications are not allowed. The cluster continues to operate without any restriction. All other operations are allowed.
-
Frozen: New members are not allowed to join, except the members left in this or the Passive state. All other operations except migrations are allowed and the cluster operates without any restriction.
-
Passive: New members are not allowed to join, except the members left in this or the Frozen state. All operations, except the ones marked with
AllowedDuringPassiveState, are rejected immediately. -
In Transition: Shows that the cluster state is in transition. This is a temporary and intermediate state. It is not allowed to set it explicitly.
Changing the Cluster State
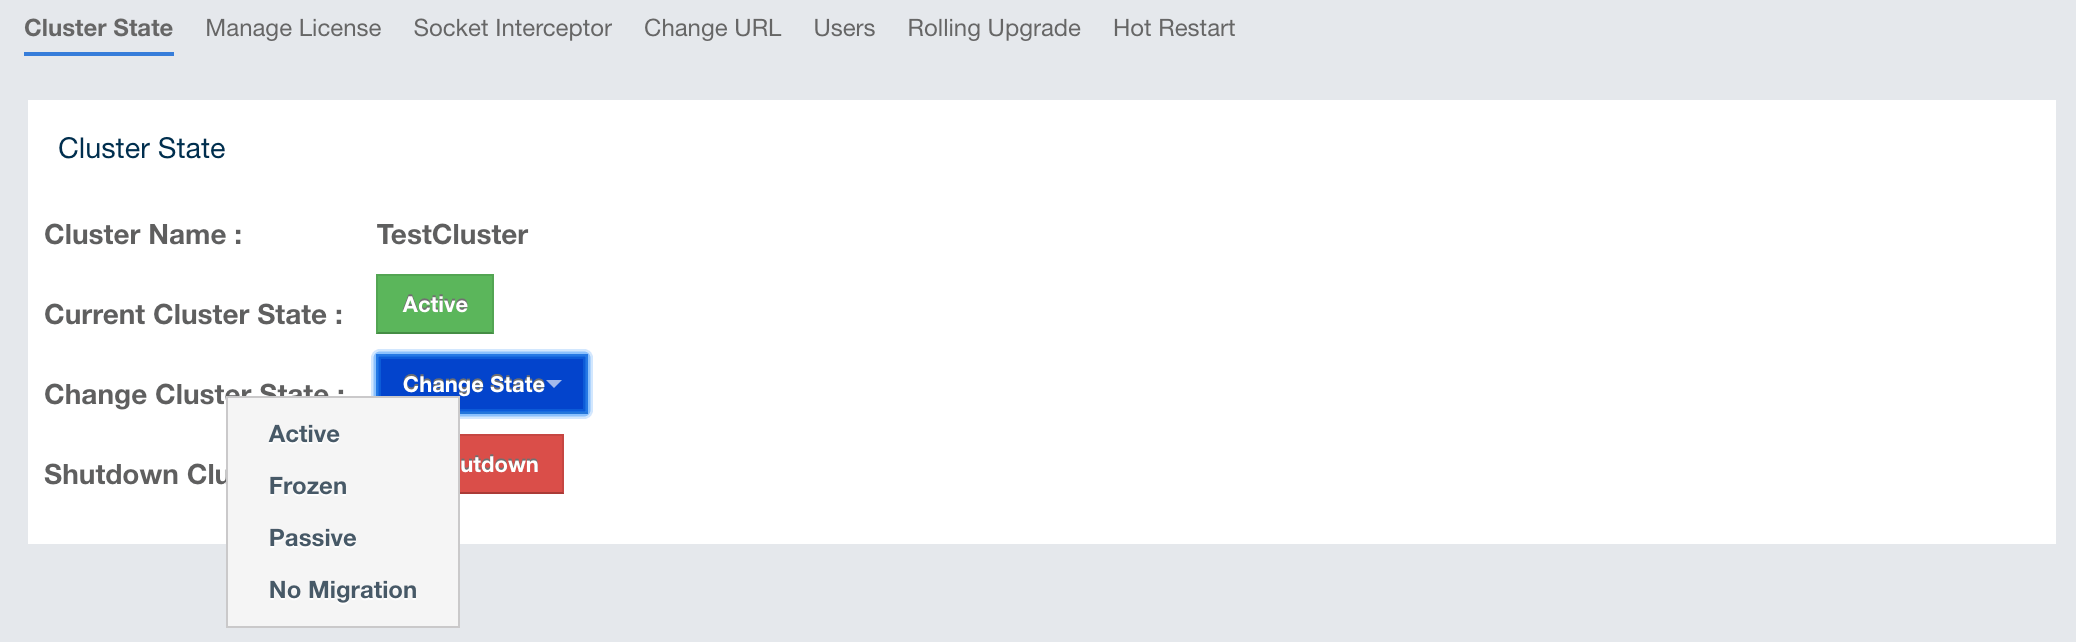
-
Click the dropdown menu and choose the state to which you want your cluster to change. A pop-up appears and stays on the screen until the state is successfully changed.
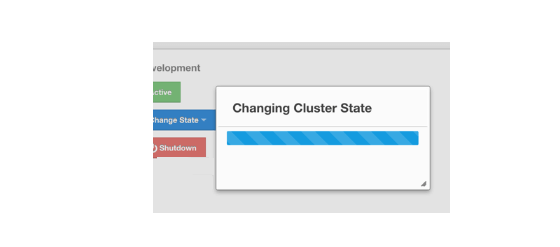
Shutting Down the Cluster
-
Click the Shutdown button. A pop-up appears and stays on the screen until the cluster is successfully shutdown.
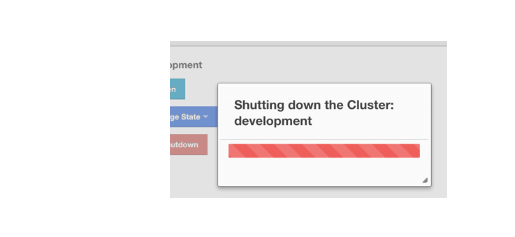
If an exception occurs during the state change or shutdown operation on the cluster, this exception message is shown on the screen as a notification.
16.2. Manage License
To update the Management Center license, you can open the Manage License tab and click on the Update License button and enter the new license code.
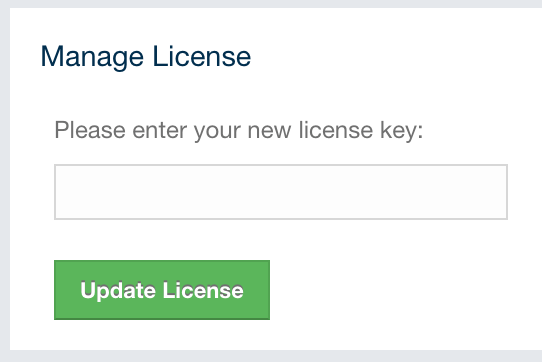
Alternatively, a license can be provided using the hazelcast.mc.license
system property (see the Starting with a License section
for details).
16.3. Socket Interceptor
If the Hazelcast IMDG cluster is configured to use a socket interceptor,
you need to configure one for Management
Center as well. Enter the name of your socket interceptor class
and the configuration parameters. Then click on the Configure Socket
Interceptor button to save your configuration and enable the socket interceptor.
The class whose name you entered into the "Class Name" field needs to be
on your classpath when you are starting the Management Center. The configuration
parameters you provide
will be used to invoke the init method of your socket interceptor
implementation if it has such a method.
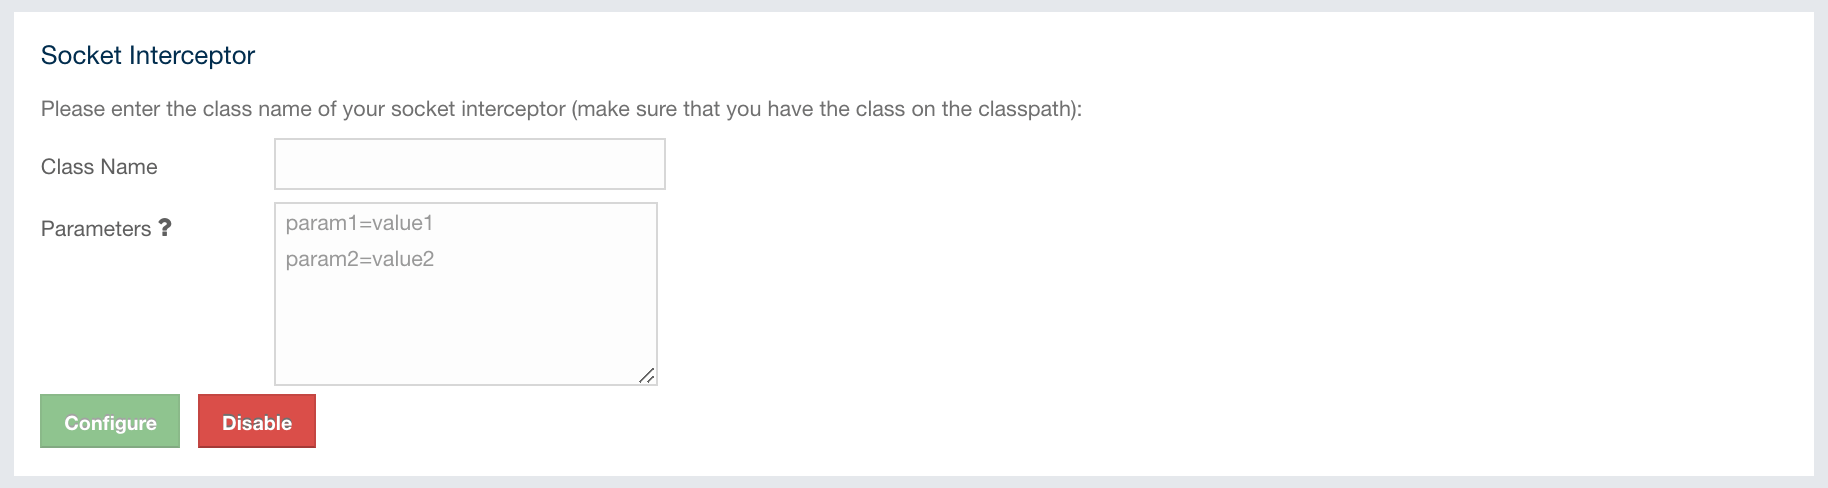
The following is an example socket interceptor class implementation:
package com.example;

import java.io.IOException;
import java.io.InputStream;
import java.io.OutputStream;
import java.net.Socket;

public class SampleSocketInterceptor {
    // this method is optional
    public void init(Map<String, String> parameters) {
        // here goes the initialization logic for your socket interceptor
    }

    public void onConnect(Socket connectedSocket) throws IOException {
        // socket interceptor logic
        try {
            OutputStream out = connectedSocket.getOutputStream();
            InputStream in = connectedSocket.getInputStream();
            int multiplyBy = 2;
            while (true) {
                int read = in.read();
                if (read == 0) {
                    break;
                }
                out.write(read * multiplyBy);
                out.flush();
            }
        } catch (IOException e) {
            throw e;
        }
    }
}
A socket interceptor implementation needs to satisfy the following conditions:
-
It has a no-argument constructor.
-
It has a public
onConnectmethod with the following signature:void onConnect(Socket connectedSocket) throws IOException
16.3.1. Disabling Socket Interceptor
To disable the socket interceptor, you need to click on the Configure Socket Interceptor button first and then click on the Disable button on the dialog.
16.4. Change URL
Hazelcast IMDG cluster members need to be configured with the Management Center’s URL before they are started. If Management Center’s URL is changed for some reason, you can use this page to make Hazelcast members send their statistics to the new Management Center URL. However, this has the following caveats:
-
This configuration change is not persistent. If a member is restarted without any updates to its configuration, it goes back to sending its statistics to the original URL
-
When a new member joins the cluster, it does not know of the URL change, and sends its statistics to the URL that it’s configured with.
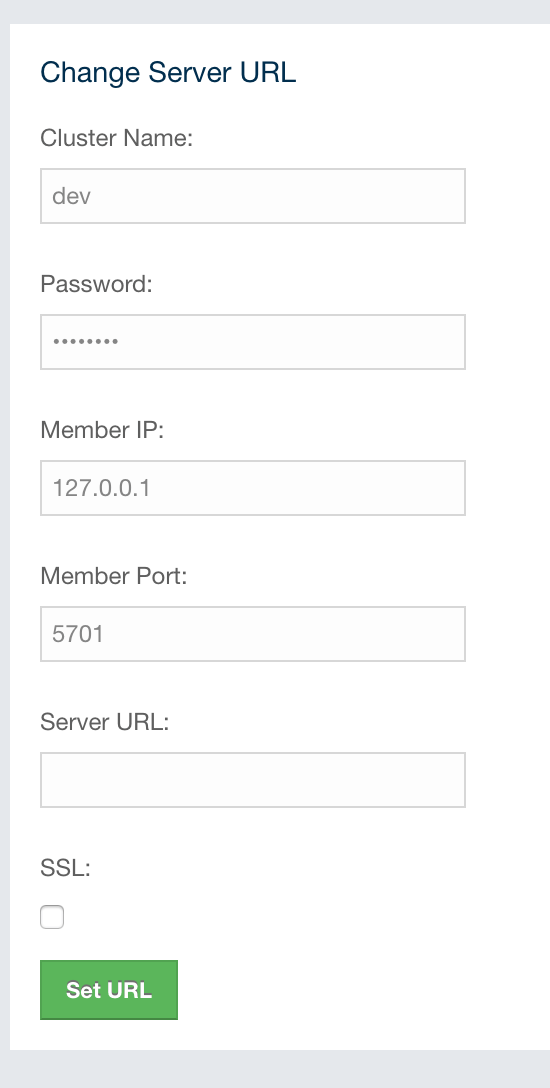
To change the URL, enter the Cluster Name and Password, provide the IP address and port for one of the members, and specify the new Management Center URL in the Server URL field. If the cluster members are configured to use TLS/SSL for communicating between themselves, check the SSL box. Clicking on the Set URL button updates the Management Center URL.
16.5. Users
| User management is only available for the default security provider. See the Default Authentication section for more information. |
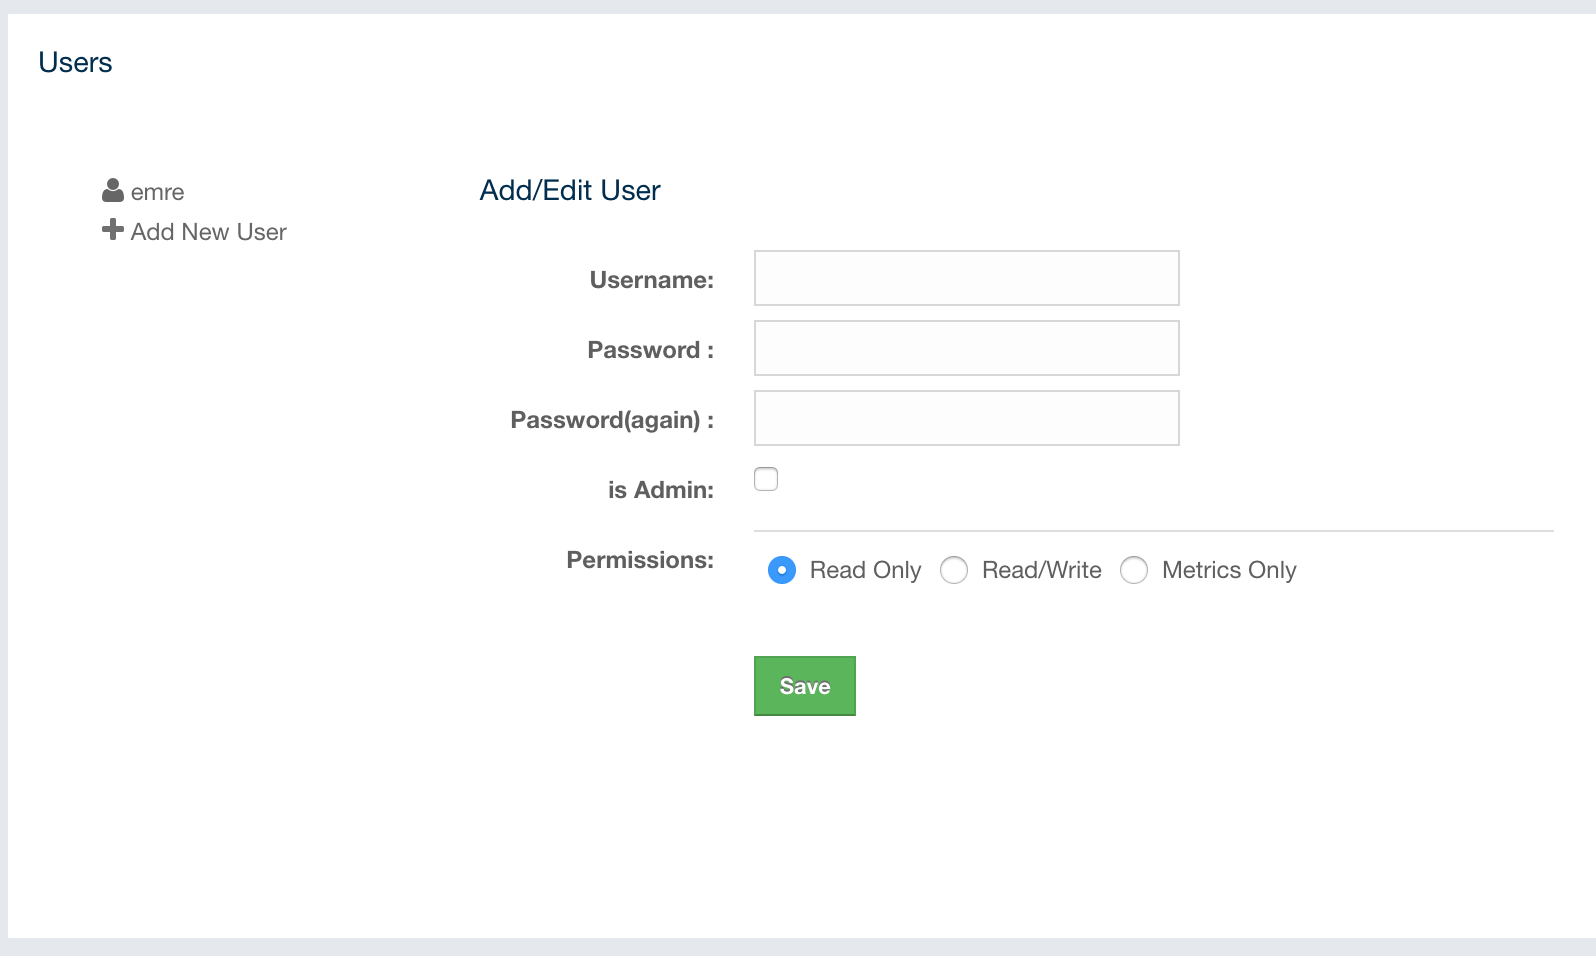
To add a user to the system, specify the username, email and password in the Add/Edit User part of the page. If the user to be added will have administrator privileges, select the isAdmin checkbox. The Permissions field has the following checkboxes:
-
Metrics Only: If this permission is given to the user, only Home, Documentation and Time Travel items will be visible at the toolbar on that user’s session. Also, the users with this permission cannot browse a map or a cache to see their contents, cannot update a map configuration, run a garbage collection and take a thread dump on a cluster member, or shutdown a member (see the Monitoring Members section).
-
Read Only: If this permission is given to the user, only Home, Documentation and Time Travel items will be visible at the toolbar on that user’s session. Also, the users with this permission cannot update a map configuration, run a garbage collection and take a thread dump on a cluster member, or shutdown a member (see the Monitoring Members section).
-
Read/Write: If this permission is given to the user, Home, Scripting, Console, Documentation and Time Travel items will be visible. The users with this permission can update a map configuration and perform operations on the members.
After you enter/select all the fields, click on the Save button to create the user. You will see the newly created user’s username on the left side, in the Users part of the page.
To edit or delete a user, select a username listed in the Users. Selected user information appears on the right side of the page. To update the user information, change the fields as desired and click on the Save button. You can also change a user’s password or delete the user account. To change the user’s password, click on the Change Password button. To delete the user from the system, click on the Delete button. Note that changing the password of a user and deleting the user account both require you to enter your own password.
| Certain user management operations are also available in the MC Conf tool. See the Management Center Configuration Tool section for more information. |
16.6. Rolling Upgrade
The admin user can upgrade the cluster version once all members of the cluster have been upgraded to the intended codebase version as described in the Rolling Upgrade Procedure section of the Hazelcast IMDG Reference Manual.
Open the Rolling Upgrade tab to perform a Rolling Upgrade and change the cluster’s version.

Enter the group name/password of the cluster and the version you want to upgrade the cluster to, and click on the Change Version button.
Once the operation succeeds, you will see the following notification:
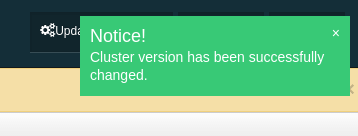
16.7. Hot Restart
Using the Hot Restart tab, you can perform force and partial start of the cluster and see the Hot Restart status of the cluster members. You can also take snapshots of the Hot Restart Store (Hot Backup). When you click on this tab, the following page is shown:
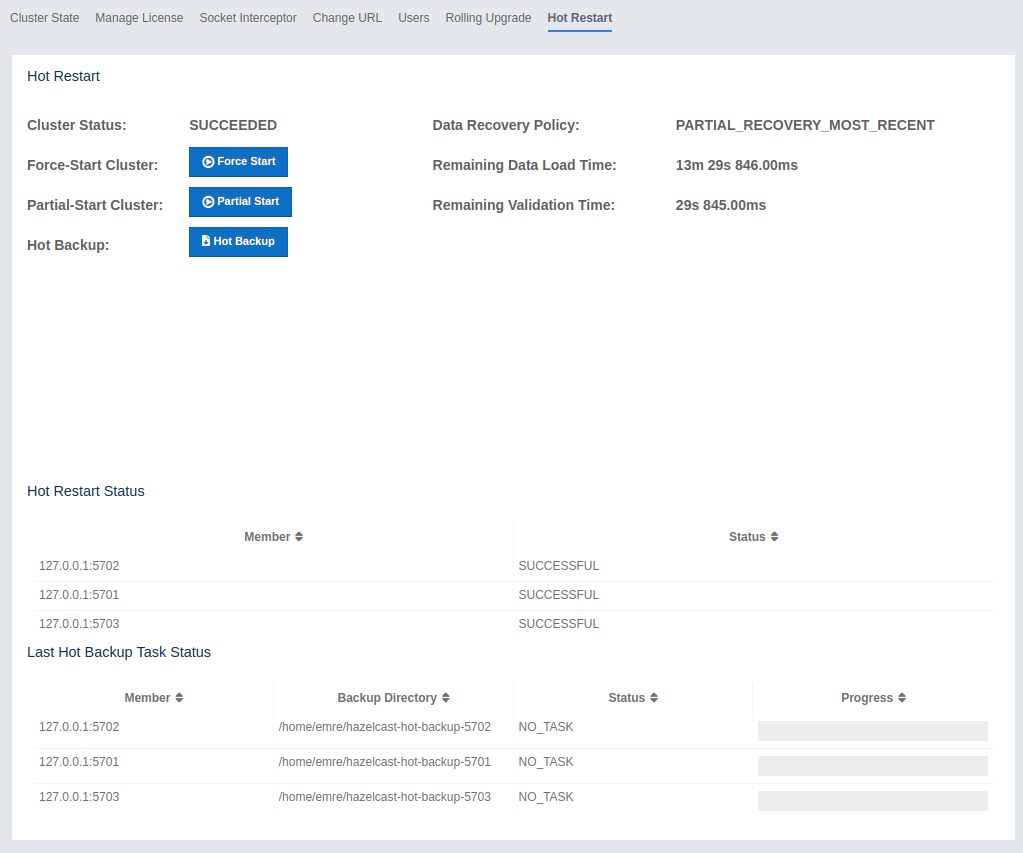
Below sections explain each operation.
16.7.1. Force Start
Restart process cannot be completed if a member crashes permanently and cannot recover from the failure since it cannot start or it fails to load its own data. In that case, you can force the cluster to clean its persisted data and make a fresh start. This process is called force start.
| See the Force Start section in the Hazelcast IMDG Reference Manual for more information on this operation. |
To perform a force start on the cluster, click on the Force Start button. A confirmation dialog appears as shown below.
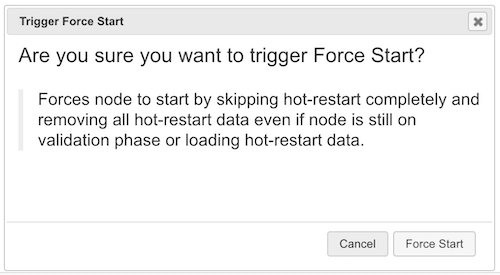
Once you click on the Force Start button on this dialog, the cluster starts the force start process and the following progress dialog shows up while doing so.
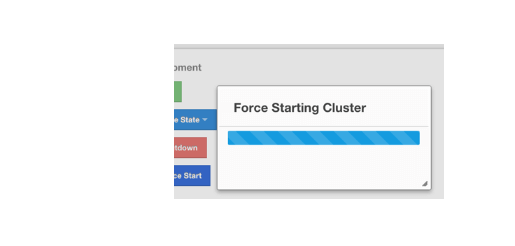
This dialog stays on the screen until the operation is triggered. Once it is done, the success of force start operation is shown as a notice dialog, as shown below.
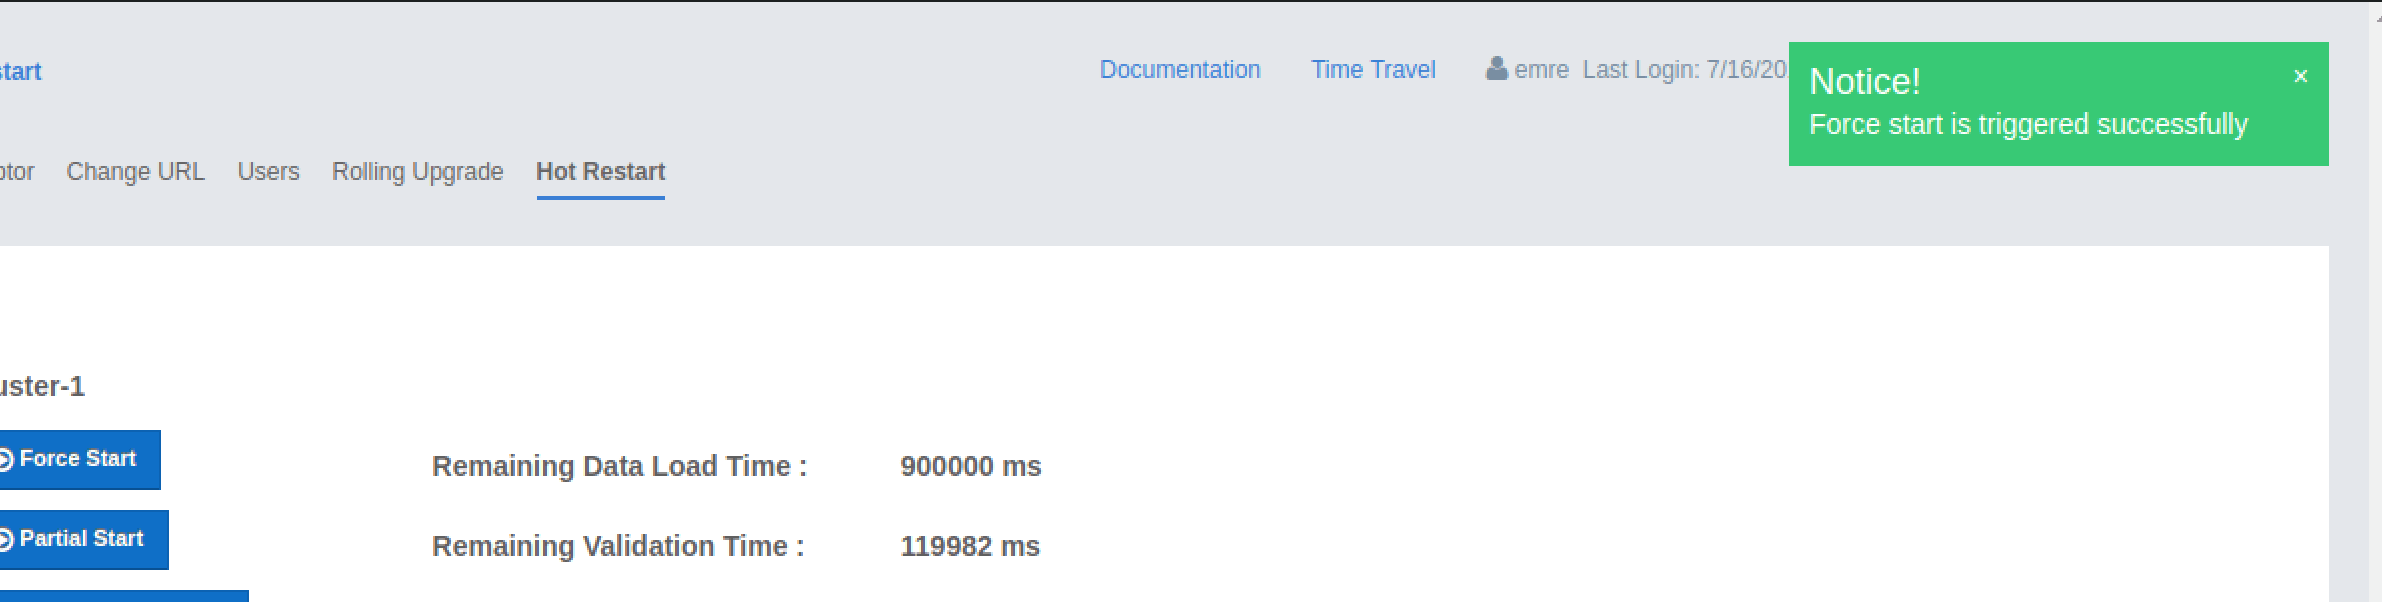
If an exception occurs, this exception message is shown on the screen as a notification.
16.7.2. Partial Start
When one or more members fail to start or have incorrect Hot Restart data (stale or corrupted data) or fail to load their Hot Restart data, the cluster becomes incomplete and the restart mechanism cannot proceed. One solution is to use Force Start and make a fresh start with the existing members, as explained above. Another solution is to do a partial start.
Partial start means that the cluster will start with an incomplete set of members. Data belonging to the missing members is assumed lost and the Management Center tries to recover the missing data using the restored backups. For example, if you have minimum two backups configured for all the maps and caches, then a partial start up to two missing members is safe against data loss. If there are more than two missing members or there are maps/caches with less than two backups, then data loss is expected.
| See the Partial Start section in the Hazelcast IMDG Reference Manual for more information on this operation and how to enable it. |
To perform a partial start on the cluster, click on the Partial Start button. A notice dialog appears as shown below.
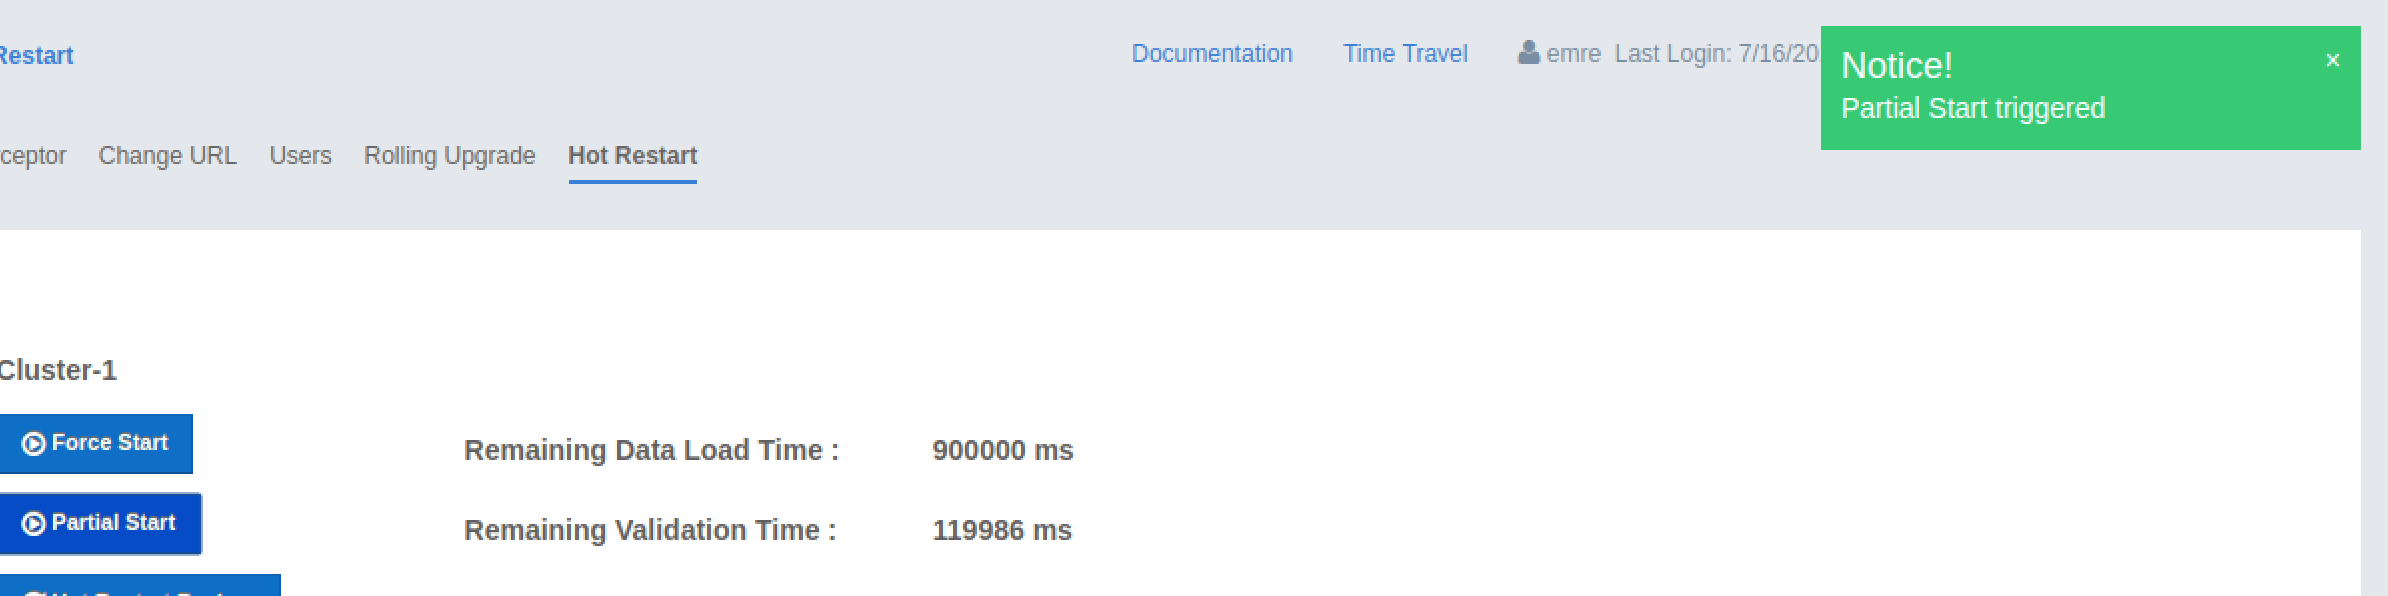
You can also see two fields related to Partial Start operation: "Remaining Data Load Time" and "Remaining Validation Time", as shown in the above screenshot.
-
Remaining Validation Time: When partial start is enabled, Hazelcast can perform a partial start automatically or manually, in case of some members are unable to restart successfully. Partial start proceeds automatically when some members fail to start and join to the cluster in
validation-timeout-seconds, which you can configure. After this duration is passed, Hot Restart chooses to perform a partial start with the members present in the cluster. This field, i.e., "Remaining Validation Time" shows how much time is left to the automatic partial start, in seconds. You can always request a manual partial start, by clicking on the Partial Start button, before this duration passes. -
Remaining Data Load Time: The other situation to decide to perform a partial start is the failures during the data loading phase. When Hazelcast learns the data loading result of all members which have passed the validation step, it automatically performs a partial start with the ones which have successfully restored their Hot Restart data. Note that partial start does not expect every member to succeed in the data loading step. It completes the process when it learns the data loading result for every member and there is at least one member which has successfully restored its Hot Restart data. Relatedly, if it cannot learn the data loading result of all members before
data-load-timeout-secondsduration, it proceeds with the ones which have already completed the data loading process. This field, i.e., "Remaining Data Load Time" shows how much time (in seconds) is left for Hazelcast to know at least one member has successfully restored its Hot Restart data and perform an automatic partial start.
See the Configuring Hot Restart section
in the Hazelcast IMDG Reference Manual for more information on the configuration elements validation-timeout-seconds
and data-load-timeout-seconds mentioned above and how to configure them.
|
Force and partial start operations can also be performed using the REST
API and the script cluster.sh. See the
Using REST API for Cluster Management section
and Using the Script cluster.sh section
in the Hazelcast IMDG Reference Manual.
|
16.7.3. Hot Backup
During Hot Restart operations, you can take a snapshot of the Hot Restart data at a certain point in time. This is useful when you wish to bring up a new cluster with the same data or parts of the data. The new cluster can then be used to share load with the original cluster, to perform testing, quality assurance or reproduce an issue on the production data.
Note that you must first configure the Hot Backup directory programmatically
(using the method setBackupDir()) or declaratively (using the element backup-dir)
to be able to take a backup of the Hot Restart data. See the
Configuring Hot Backup section
in the Hazelcast IMDG Reference Manual.
If the backup directory is configured, you can start to perform the backup by clicking on the Hot Backup button. The Management Center first asks the cluster password as shown in the following dialog.
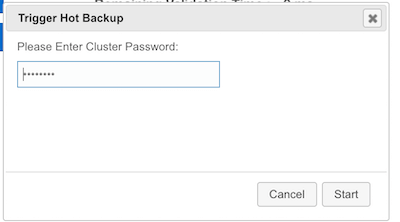
Once you entered the password correctly and click on the "Start" button on this dialog, you will see a notification dialog stating that the backup process starts. You can see the progress of the backup operation under the "Last Hot Backup Task Status" part of the page, as shown below.
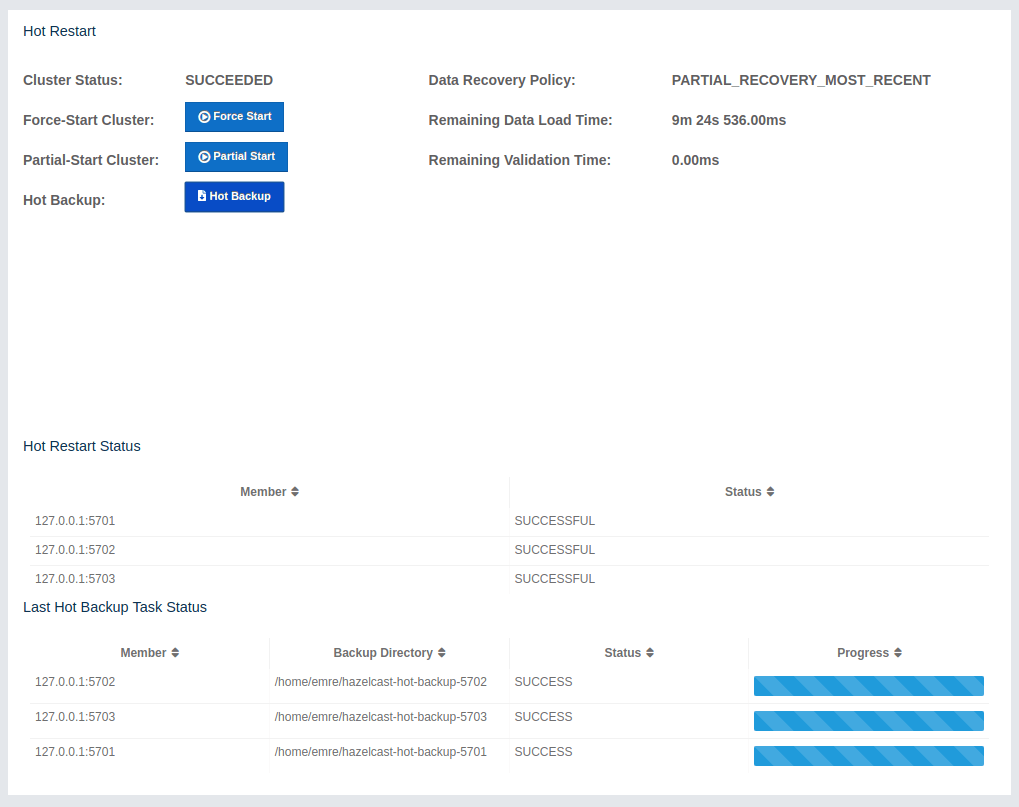
16.7.4. Status Information
At the bottom of "Hot Restart" tab, you can see the Hot Restart and Hot Backup statuses of cluster members, as shown below.
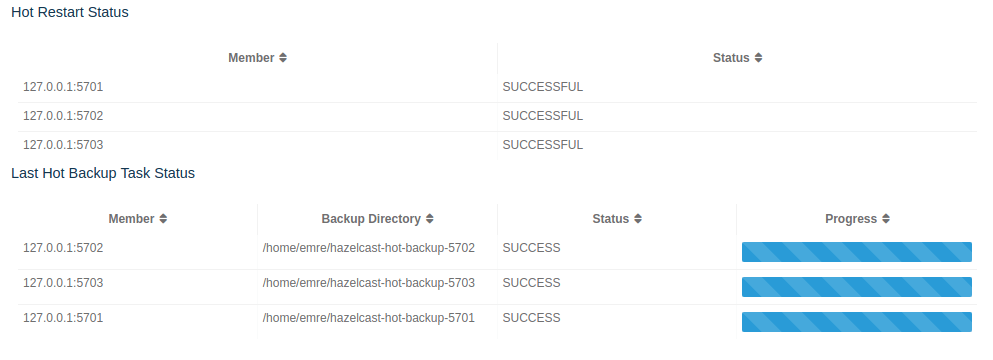
You can see the status and progress of your Hot Backup operation under "Last Hot Backup Task Status". It can be IN_PROGRESS and SUCCESS/FAILURE according to the result of the operation.
You can also see the status of Hot Restart operation of your cluster members, under "Hot Restart Status". It can be PENDING and SUCCESSFUL/FAILED according to the result of Hot Restart operation.
16.8. CP Subsystem
| CP subsystem management operations require enabled REST API in the IMDG cluster. See the IMDG documentation for more information. |
The CP Subsystem tab can be used to monitor overall status of the CP subsystem in the current cluster and perform certain management operations.
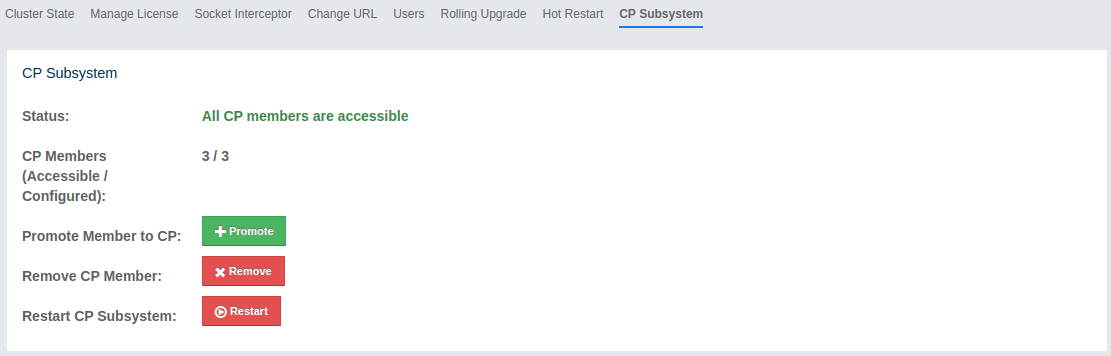
16.8.1. Monitoring CP Subsystem
The Status field shows a summary of the current CP subsystem status. It may have one of the following values:
-
CP Subsystem is not supported by this cluster: Shown for IMDG clusters with version prior to 3.12.
-
CP Subsystem is not enabled: Shown if CP subsystem is not enabled for the current cluster.
-
All CP members are accessible: Shown if there are at least the same amount of accessible CP members as the configured CP member count.
-
CP Subsystem warning: one CP member is not accessible: Shown if there is one missing CP member and the minority count in the CP subsystem is greater than 1. For example, this value is shown when there are 6 accessible CP members and the configured count is 7. In this example, the minority count is 3 members and the majority count is 4 members.
-
CP Subsystem alert: multiple CP members are not accessible: Shown if there are multiple missing CP members, but their count is less than the minority.
-
CP Subsystem error: minority of the CP members are not accessible: Shown if the minority of CP members are missing.
-
CP Subsystem error: majority of the CP members are not accessible: Shown if the majority of CP members are missing.
The CP Members (Accessible/Configured) field shows the current count of accessible CP members and the configured CP members count.
| You may promote additional members or remove inaccessible CP members, so the total count of members that participate in the CP subsystem may be greater or less than the configured CP member count. As the Status field considers the configured CP member count as the total CP member count, it should be treated only as a basic health indicator for the CP subsystem. |
16.8.2. Managing CP Subsystem
You can also use the CP Subsystem tab to start the following management operations.
Promote Member to CP Subsystem
To promote one of the AP members to become a CP member, click on the Promote button. A confirmation dialog appears as shown below.
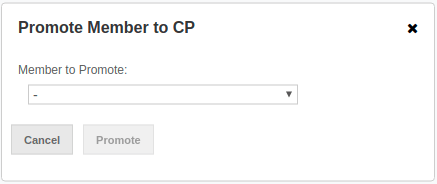
It asks you to choose one of AP members, i.e., one of the members that do not participate in the CP subsystem. Note that lite members are not shown in the dropdown list as lite members do not store data. Once you press the Promote button, the CP subsystem starts the promote operation for the given member.
Remove CP Member
To remove one of the inaccessible CP members from the CP subsystem, click on the Remove button. A confirmation dialog appears as shown below.
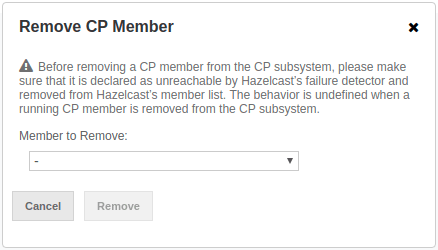
It asks you to choose one of the members that is not connected to the Management Center, but is known by the cluster’s CP subsystem. Once you press the Remove button, the CP subsystem starts the remote operation for the given member.
Restart CP Subsystem
To wipe and restart the whole CP subsystem of the cluster, click on the Restart button. A confirmation dialog appears as shown below.
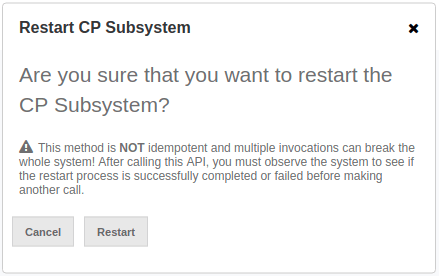
Once you press the Restart button, CP subsystem proceeds with the restart operation.
| The CP subsystem restart operation is NOT idempotent and multiple invocations can break the whole system! After using this dialog, you must observe the system to see if the restart process is successfully completed or failed before starting this operation again. |
17. License Information
Using the "License" menu item, you can view the details of your Management Center and cluster licenses. An example screenshot is shown below.
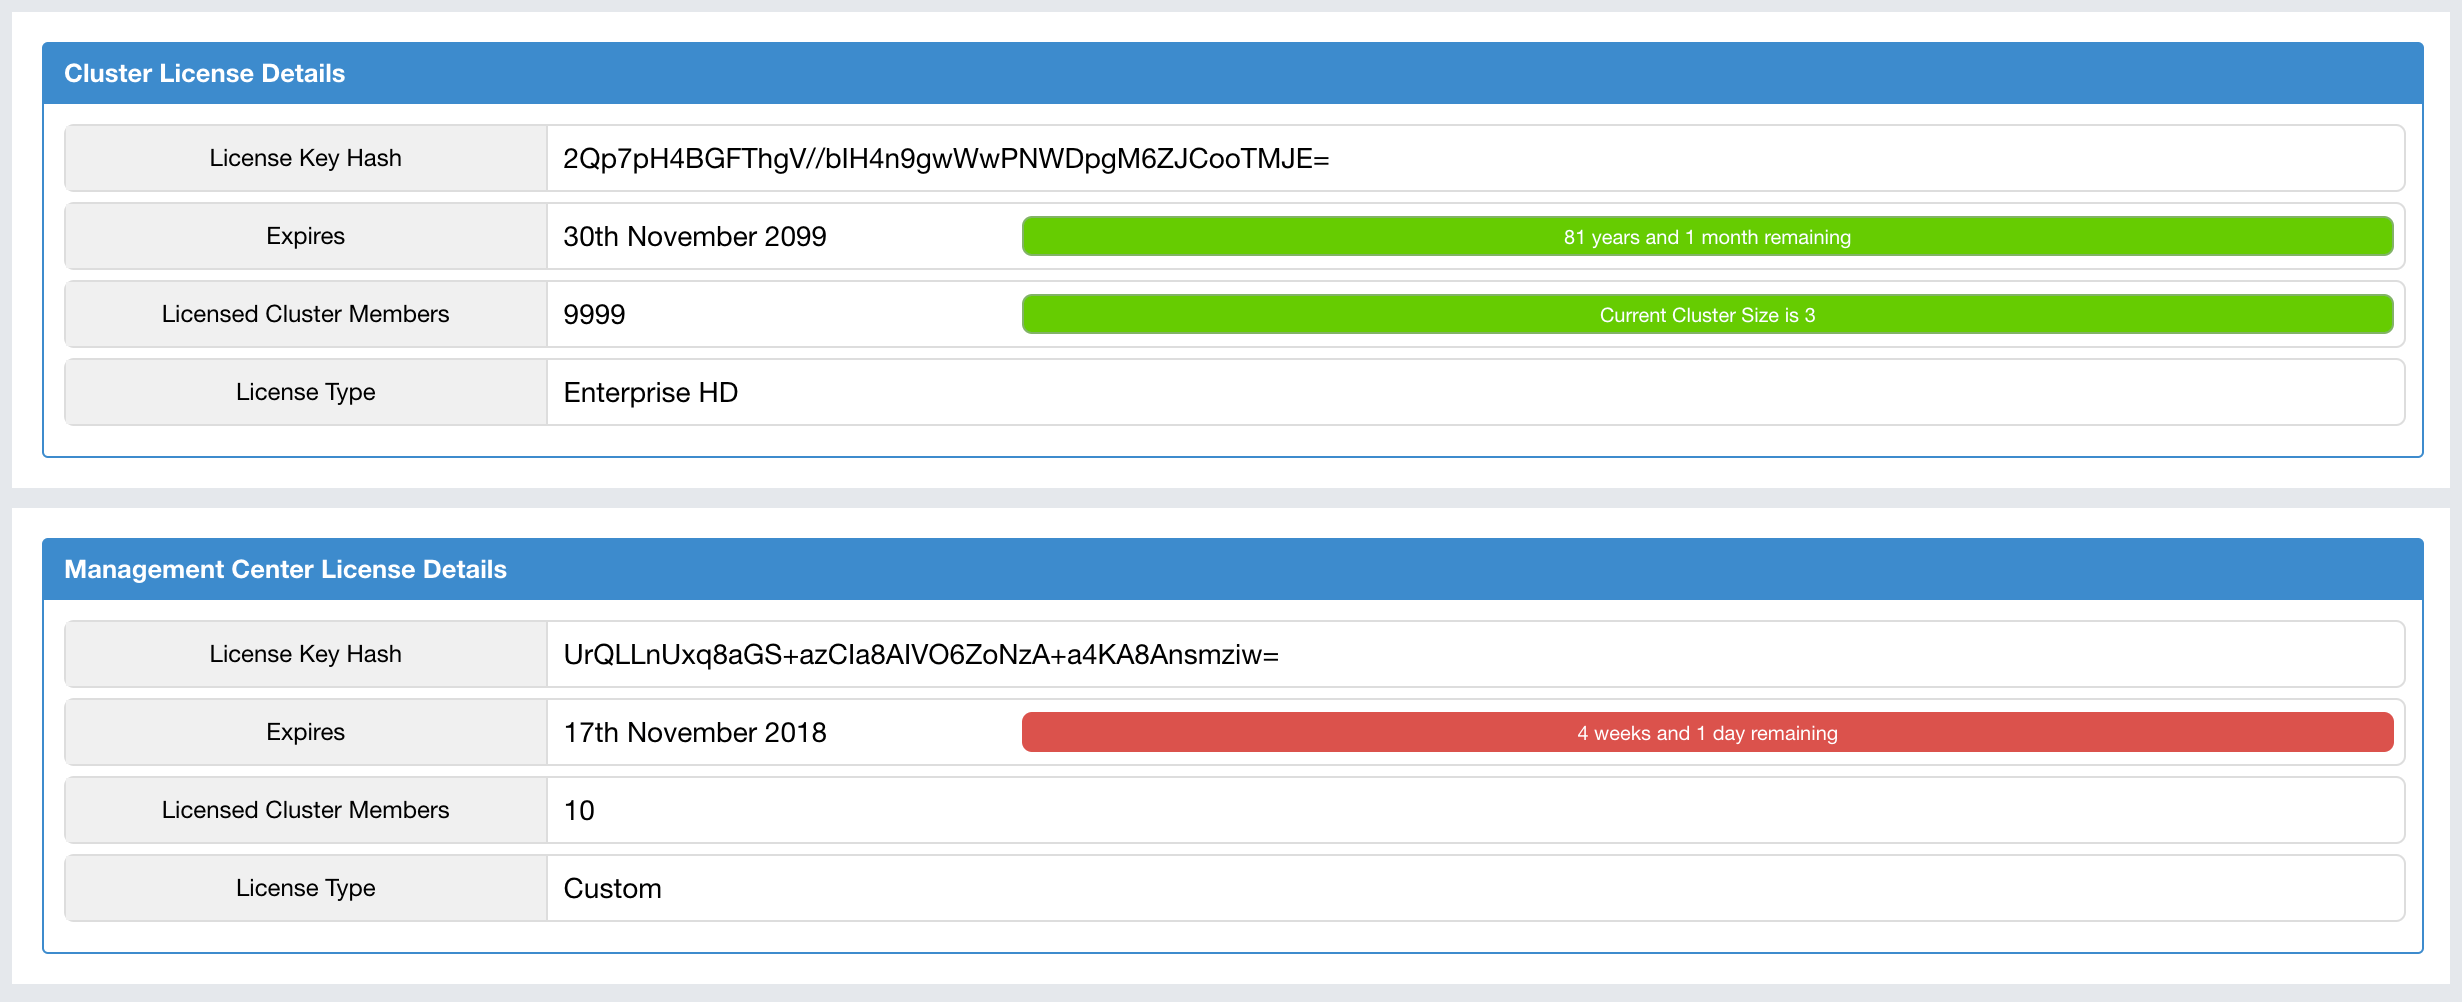
It shows the expiration date, total licensed member count and type of your Management Center and cluster licenses.
For security reasons, the license key itself is not shown. Instead, SHA-256 hash of the key as a Base64 encoded string is shown.
If there are any problems related to your Management Center or cluster license, "License" menu item will be highlighted with red exclamation points, as shown below.
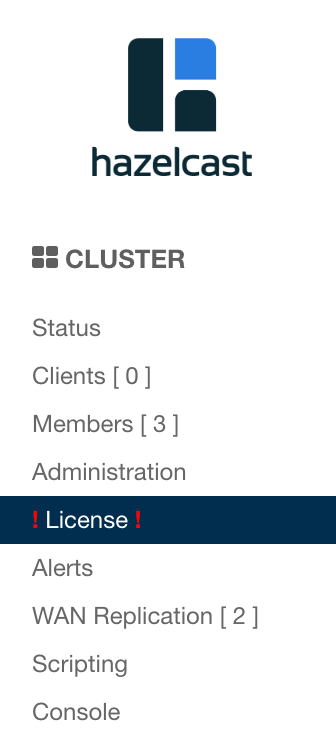
In this case, please check this screen to see what the problem is. The following are the possible problems:
-
One or both of your licenses are expired.
-
The count of your cluster members is more than the allowed count by the license.
If the license of Management Center or cluster expires in 30 days or less, or has already expired, a warning will appear in the upper right corner once a day. Warning will contain time remaining until license expires or how long the license is expired. There will also be two buttons - the first one with label "Show License" will redirect you to the license page, the second one with label "Dismiss Alert" will dismiss the alert. An example screenshot is shown below.
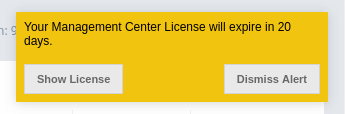
18. Checking Past Status with Time Travel
Use the Time Travel toolbar item to check the status of the cluster at a time in the past. When you select it on the toolbar, a small window appears on top of the page, as shown below:
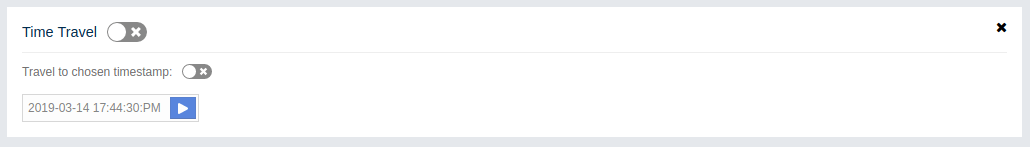
To see the cluster status in a past time, you should first enable the time travel. Turn on the switch with the "Time Travel" label. It changes to ON after it asks whether to enable the time travel with a dialog. Click on Enable in the dialog to enable it.
Once it is ON, the status of your cluster will be stored on your disk as long as your web server is alive.
Unless you turn on the switch with the "Travel to chosen timestamp" label, you will continue seeing the latest data. When you turn the switch on, you can go back in time using the calendar and check your cluster’s situation at the selected time. All the data structures and members can be monitored as if you are using the Management Center normally (charts and data tables for each data structure and members). It shows the status if time travel has been ON at the selected time in past; otherwise, all the charts and tables are shown as empty.
In the "Travel to chosen timestamp" mode, the graphs do not refresh continuously. You will see data for the selected time. You can press the blue button next to the calendar to see the latest data. Note that this will only show you the latest data and not cause the charts and data tables refresh with latest data continuously. For that, you need to turn off the switch with the "Travel to chosen timestamp" label.
The historical data collected with the time travel feature is stored in a file database
on the disk. The data files can be found in the <User‘s Home Directory>/hazelcast-mc directory, e.g.,
/home/someuser/hazelcast-mc. This directory can be changed using the hazelcast.mc.home
property on the server where the Management Center is running.
Time travel data files are created monthly. Their file name format is
[group-name]-[year][month].db and [group-name]-[year][month].lg.
Time travel data is kept in the *.db files. The files with the extension lg are temporary
files created internally and you do not have to worry about them.
| Due to security concerns, time travel can only be used if the cluster name consists of alphanumeric characters, underscores and dashes. |
19. Clustered REST via Management Center
Hazelcast IMDG Enterprise
The Clustered REST API is exposed from the Management Center to allow you to monitor clustered statistics of distributed objects.
19.1. Enabling Clustered REST
To enable Clustered REST on your Management Center, pass the following system property at startup. This property is disabled by default.
-Dhazelcast.mc.rest.enabled=true19.2. Clustered REST API Root
The entry point for the Clustered REST API is /rest/. This
resource does not have any attributes.
All parameters that are used in the REST API URLs, like
cluster names and distributed data structure names, must be
URL encoded when composing
a valid request for Clustered REST.
Such parameters are marked in braces ({ and }) in the URL description
for each endpoint. As an example, name.with/special@chars
parameter value would be encoded as name.with%2Fspecial%40chars.
|
| All endpoints return HTTP status code 404 if no data about a cluster, member, client or data structure can be found in the Management Center. |
19.2.1. Retrieve Management Center License Expiration Time
This endpoint returns the expiration time in milliseconds (since epoch)
of the license key assigned for the Management Center.
Returns -1 if no license is assigned.
-
Request Type: GET
-
URL:
/rest/license -
Request:
curl http://localhost:8083/hazelcast-mancenter/rest/license -
Response:
200(application/json) -
Body:
{
  "licenseExpirationTime": 4099755599515
}
19.3. Clusters Resource
This resource returns a list of clusters that are connected to the Management Center.
19.3.1. Retrieve Clusters
-
Request Type: GET
-
URL:
/rest/clusters -
Request:
curl http://localhost:8083/hazelcast-mancenter/rest/clusters -
Response:
200(application/json) -
Body:
["dev", "qa"]
19.4. Cluster Resource
This resource returns information related to the provided cluster name.
19.4.1. Retrieve Cluster Information
This endpoint returns address of the oldest cluster member and the expiration
time in milliseconds (since epoch) of the license
key assigned for the cluster. Returns -1 for license expiration time if no license is assigned.
-
Request Type: GET
-
URL:
/rest/clusters/{clustername} -
Request:
curl http://localhost:8083/hazelcast-mancenter/rest/clusters/dev/ -
Response:
200(application/json) -
Body:
{
  "masterAddress": "192.168.2.78:5701",
  "licenseExpirationTime": 4099755599515
}
19.5. Members Resource
This resource returns a list of the members belonging to the provided clusters.
19.5.1. Retrieve Members [GET] [/rest/clusters/{clustername}/members]
-
Request Type: GET
-
URL:
/rest/clusters/{clustername}/members -
Request:
curl http://localhost:8083/hazelcast-mancenter/rest/clusters/dev/members -
Response:
200(application/json) -
Body:
[
  "192.168.2.78:5701",
  "192.168.2.78:5702",
  "192.168.2.78:5703",
  "192.168.2.78:5704"
]
19.6. Member Resource
This resource returns information related to the provided member.
19.6.1. Retrieve Member Information
-
Request Type: GET
-
URL:
/rest/clusters/{clustername}/members/{member} -
Request:
curl http://localhost:8083/hazelcast-mancenter/rest/clusters/dev/members/192.168.2.78:5701 -
Response:
200(application/json) -
Body:
{
  "cluster": "dev",
  "name": "192.168.2.78:5701",
  "uuid": "11adba52-e19d-4407-a9e9-e0a271cef14a",
  "cpMemberUuid": "f5a8f8a4-f278-4a13-a23e-5accf5b02f42",
  "maxMemory": 129957888,
  "ownedPartitionCount": 68,
  "usedMemory": 60688784,
  "freeMemory": 24311408,
  "totalMemory": 85000192,
  "connectedClientCount": 1,
  "master": true
}
19.6.2. Retrieve Connection Manager Information
-
Request Type: GET
-
URL:
/rest/clusters/{clustername}/members/{member}/connectionManager -
Request:
curl http://localhost:8083/hazelcast-mancenter/rest/clusters/dev/members/192.168.2.78:5701/connectionManager -
Response:
200(application/json) -
Body:
{
  "clientConnectionCount": 2,
  "activeConnectionCount": 5,
  "connectionCount": 5
}
19.6.3. Retrieve Operation Service Information
-
Request Type: GET
-
URL:
/rest/clusters/{clustername}/members/{member}/operationService -
Request:
curl http://localhost:8083/hazelcast-mancenter/rest/clusters/dev/members/192.168.2.78:5701/operationService -
Response:
200(application/json) -
Body:
{
  "responseQueueSize": 0,
  "operationExecutorQueueSize": 0,
  "runningOperationsCount": 0,
  "remoteOperationCount": 1,
  "executedOperationCount": 461139,
  "operationThreadCount": 8
}
19.6.4. Retrieve Event Service Information
-
Request Type: GET
-
URL:
/rest/clusters/{clustername}/members/{member}/eventService -
Request:
curl http://localhost:8083/hazelcast-mancenter/rest/clusters/dev/members/192.168.2.78:5701/eventService -
Response:
200(application/json) -
Body:
{
  "eventThreadCount": 5,
  "eventQueueCapacity": 1000000,
  "eventQueueSize": 0
}
19.6.5. Retrieve Partition Service Information
-
Request Type: GET
-
URL:
/rest/clusters/{clustername}/members/{member}/partitionService -
Request:
curl http://localhost:8083/hazelcast-mancenter/rest/clusters/dev/members/192.168.2.78:5701/partitionService -
Response:
200(application/json) -
Body:
{
  "partitionCount": 271,
  "activePartitionCount": 68
}
19.6.6. Retrieve Proxy Service Information
-
Request Type: GET
-
URL:
/rest/clusters/{clustername}/members/{member}/proxyService -
Request:
curl http://localhost:8083/hazelcast-mancenter/rest/clusters/dev/members/192.168.2.78:5701/proxyService -
Response:
200(application/json) -
Body:
{
  "proxyCount": 8
}
19.6.7. Retrieve All Managed Executors
-
Request Type: GET
-
URL:
/rest/clusters/{clustername}/members/{member}/managedExecutors -
Request:
curl http://localhost:8083/hazelcast-mancenter/rest/clusters/dev/members/192.168.2.78:5701/managedExecutors -
Response:
200(application/json) -
Body:
["hz:system", "hz:scheduled", "hz:client", "hz:query", "hz:io", "hz:async"]
19.6.8. Retrieve a Managed Executor
-
Request Type: GET
-
URL:
/rest/clusters/{clustername}/members/{member}/managedExecutors/{managedExecutor} -
Request:
curl http://localhost:8083/hazelcast-mancenter/rest/clusters/dev/members/192.168.2.78:5701 /managedExecutors/hz:system -
Response:
200(application/json) -
Body:
{
  "name": "hz:system",
  "queueSize": 0,
  "poolSize": 0,
  "remainingQueueCapacity": 2147483647,
  "maximumPoolSize": 4,
  "completedTaskCount": 12,
  "terminated": false
}
19.7. Client Endpoints Resource
This resource returns a list of the client endpoints belonging to the provided cluster. Consider using the newly added Client Statistics Resource as it contains more detailed information about the clients.
19.7.1. Retrieve List of Client Endpoints
-
Request Type: GET
-
URL:
/rest/clusters/{clustername}/clients -
Request:
curl http://localhost:8083/hazelcast-mancenter/rest/clusters/dev/clients -
Response:
200(application/json) -
Body:
["192.168.2.78:61708"]
19.7.2. Retrieve Client Endpoint Information
-
Request Type: GET
-
URL:
/rest/clusters/{clustername}/clients/{client} -
Request:
curl http://localhost:8083/hazelcast-mancenter/rest/clusters/dev/clients/192.168.2.78:61708 -
Response:
200(application/json) -
Body:
{
  "uuid": "6fae7af6-7a7c-4fa5-b165-cde24cf070f5",
  "address": "192.168.2.78:61708",
  "clientType": "JAVA",
  "name": "hz.client_1",
  "labels": [
    "label1"
  ],
  "ipAddress": "192.168.2.78",
  "canonicalHostName": "localhost"
}
19.8. Maps Resource
This resource returns a list of maps belonging to the provided cluster.
19.8.1. Retrieve List of Maps
-
Request Type: GET
-
URL:
/rest/clusters/{clustername}/maps -
Request:
curl http://localhost:8083/hazelcast-mancenter/rest/clusters/dev/maps -
Response:
200(application/json) -
Body:
["customers", "orders"]
19.8.2. Retrieve Map Information
-
Request Type: GET
-
URL:
/rest/clusters/{clustername}/maps/{mapName} -
Request:
curl http://localhost:8083/hazelcast-mancenter/rest/clusters/dev/maps/customers -
Response:
200(application/json) -
Body:
{
  "cluster": "dev",
  "name": "customers",
  "ownedEntryCount": 5085,
  "backupEntryCount": 5076,
  "ownedEntryMemoryCost": 833940,
  "backupEntryMemoryCost": 832464,
  "heapCost": 1666668,
  "lockedEntryCount": 2,
  "dirtyEntryCount": 0,
  "hits": 602,
  "lastAccessTime": 1532689094579,
  "lastUpdateTime": 1532689094576,
  "creationTime": 1532688789256,
  "putOperationCount": 5229,
  "getOperationCount": 2162,
  "removeOperationCount": 150,
  "otherOperationCount": 3687,
  "events": 10661,
  "maxPutLatency": 48,
  "maxGetLatency": 35,
  "maxRemoveLatency": 18034,
  "avgPutLatency": 0.5674125071715433,
  "avgGetLatency": 0.2479185938945421,
  "avgRemoveLatency": 5877.986666666667
}
19.9. MultiMaps Resource
This resource returns a list of multimaps belonging to the provided cluster.
19.9.1. Retrieve List of MultiMaps
-
Request Type: GET
-
URL:
/rest/clusters/{clustername}/multimaps -
Request:
curl http://localhost:8083/hazelcast-mancenter/rest/clusters/dev/multimaps -
Response:
200(application/json) -
Body:
["customerAddresses"]
19.9.2. Retrieve MultiMap Information
-
Request Type: GET
-
URL:
/rest/clusters/{clustername}/multimaps/{multimapname} -
Request:
curl http://localhost:8083/hazelcast-mancenter/rest/clusters/dev/multimaps/customerAddresses -
Response:
200(application/json) -
Body:
{
  "cluster": "dev",
  "name": "customerAddresses",
  "ownedEntryCount": 4862,
  "backupEntryCount": 4860,
  "ownedEntryMemoryCost": 0,
  "backupEntryMemoryCost": 0,
  "heapCost": 0,
  "lockedEntryCount": 1,
  "dirtyEntryCount": 0,
  "hits": 22,
  "lastAccessTime": 1532689253314,
  "lastUpdateTime": 1532689252591,
  "creationTime": 1532688790593,
  "putOperationCount": 5125,
  "getOperationCount": 931,
  "removeOperationCount": 216,
  "otherOperationCount": 373570,
  "events": 0,
  "maxPutLatency": 8,
  "maxGetLatency": 1,
  "maxRemoveLatency": 18001,
  "avgPutLatency": 0.3758048780487805,
  "avgGetLatency": 0.11170784103114931,
  "avgRemoveLatency": 1638.8472222222222
}
19.10. ReplicatedMaps Resource
This resource returns a list of replicated maps belonging to the provided cluster.
19.10.1. Retrieve List of ReplicatedMaps
-
Request Type: GET
-
URL:
/rest/clusters/{clustername}/replicatedmaps -
Request:
curl http://localhost:8083/hazelcast-mancenter/rest/clusters/dev/replicatedmaps -
Response:
200(application/json) -
Body:
["replicated-map-1"]
19.10.2. Retrieve ReplicatedMap Information
-
Request Type: GET
-
URL:
/rest/clusters/{clustername}/replicatedmaps/{replicatedmapname} -
Request:
curl http://localhost:8083/hazelcast-mancenter/rest/clusters/dev/replicatedmaps/replicated-map-1 -
Response:
200(application/json) -
Body:
{
  "cluster": "dev",
  "name": "replicated-map-1",
  "ownedEntryCount": 10955,
  "ownedEntryMemoryCost": 394380,
  "hits": 15,
  "lastAccessTime": 1532689312581,
  "lastUpdateTime": 1532689312581,
  "creationTime": 1532688789493,
  "putOperationCount": 11561,
  "getOperationCount": 1051,
  "removeOperationCount": 522,
  "otherOperationCount": 355552,
  "events": 6024,
  "maxPutLatency": 1,
  "maxGetLatency": 1,
  "maxRemoveLatency": 1,
  "avgPutLatency": 0.006400830377994983,
  "avgGetLatency": 0.012369172216936251,
  "avgRemoveLatency": 0.011494252873563218
}
19.11. Queues Resource
This resource returns a list of queues belonging to the provided cluster.
19.11.1. Retrieve List of Queues
-
Request Type: GET
-
URL:
/rest/clusters/{clustername}/queues -
Request:
curl http://localhost:8083/hazelcast-mancenter/rest/clusters/dev/queues -
Response:
200(application/json) -
Body:
["messages"]
19.11.2. Retrieve Queue Information
-
Request Type: GET
-
URL:
/rest/clusters/{clustername}/queues/{queueName} -
Request:
curl http://localhost:8083/hazelcast-mancenter/rest/clusters/dev/queues/messages -
Response:
200(application/json) -
Body:
{
  "cluster": "dev",
  "name": "messages",
  "ownedItemCount": 55408,
  "backupItemCount": 55408,
  "minAge": 0,
  "maxAge": 0,
  "aveAge": 0,
  "numberOfOffers": 55408,
  "numberOfRejectedOffers": 0,
  "numberOfPolls": 0,
  "numberOfEmptyPolls": 0,
  "numberOfOtherOperations": 0,
  "numberOfEvents": 0,
  "creationTime": 1403602694196
}
19.12. Topics Resource
This resource returns a list of topics belonging to the provided cluster.
19.12.1. Retrieve List of Topics
-
Request Type: GET
-
URL:
/rest/clusters/{clustername}/topics -
Request:
curl http://localhost:8083/hazelcast-mancenter/rest/clusters/dev/topics -
Response:
200(application/json) -
Body:
["news"]
19.12.2. Retrieve Topic Information
-
Request Type: GET
-
URL:
/rest/clusters/{clustername}/topics/{topicName} -
Request:
curl http://localhost:8083/hazelcast-mancenter/rest/clusters/dev/topics/news -
Response:
200(application/json) -
Body:
{
  "cluster": "dev",
  "name": "news",
  "numberOfPublishes": 56370,
  "totalReceivedMessages": 56370,
  "creationTime": 1403602693411
}
19.13. Executors Resource
This resource returns a list of executors belonging to the provided cluster.
19.13.1. Retrieve List of Executors
-
Request Type: GET
-
URL:
/rest/clusters/{clustername}/executors -
Request:
curl http://localhost:8083/hazelcast-mancenter/rest/clusters/dev/executors -
Response:
200(application/json) -
Body:
["order-executor"]
19.13.2. Retrieve Executor Information [GET] [/rest/clusters/{clustername}/executors/{executorName}]
-
Request Type: GET
-
URL:
/rest/clusters/{clustername}/executors/{executorName} -
Request:
curl http://localhost:8083/hazelcast-mancenter/rest/clusters/dev/executors/order-executor -
Response:
200(application/json) -
Body:
{
  "cluster": "dev",
  "name": "order-executor",
  "creationTime": 1403602694196,
  "pendingTaskCount": 0,
  "startedTaskCount": 1241,
  "completedTaskCount": 1241,
  "cancelledTaskCount": 0
}
19.14. Client Statistics Resource
This resource returns a list of clients belonging to the provided cluster.
19.14.1. Retrieve List of Client UUIDs
-
Request Type: GET
-
URL:
/rest/clusters/{clustername}/clientStats -
Request:
curl http://localhost:8083/hazelcast-mancenter/rest/clusters/dev/clientStats -
Response:
200(application/json) -
Body:
[
  "f3b1e0e9-ea67-41b2-aba5-ea7480f02a93",
  "cebf4dc9-852c-4605-a181-ffe1cca371a4",
  "2371eed5-26e0-4470-92c1-41ea17110ef6",
  "139990b3-fbc0-43a8-9c12-be53913333f7",
  "d0364a1e-8665-46a8-af1d-be1af5580d07",
  "7f337f8a-3538-4b5c-8ffc-9d4ae459e956",
  "6ef9b6e5-5add-40d9-9319-ce502f55b5fc",
  "fead3a99-19de-431c-9dd0-d6ecc4a4b9c8",
  "e788e04e-2ded-4992-9d76-52c1973216e5",
  "654fc9fb-c5c1-48a0-9b69-0c129fce860f"
]
19.14.2. Retrieve Detailed Client Statistics [GET] [/rest/clusters/{clustername}/clientStats/{clientUuid}]
-
Request Type: GET
-
URL:
/rest/clusters/{clustername}/clientStats/{clientUuid} -
Request:
curl http://localhost:8083/hazelcast-mancenter/rest/clusters/dev/clientStats/2371eed5-26e0-4470-92c1-41ea17110ef6 -
Response:
200(application/json) -
Body:
{
  "type": "JAVA",
  "name": "hz.client_7",
  "address": "127.0.0.1:42733",
  "clusterConnectionTimestamp": 1507874427419,
  "enterprise": true,
  "lastStatisticsCollectionTime": 1507881309434,
  "osStats": {
    "committedVirtualMemorySize": 12976173056,
    "freePhysicalMemorySize": 3615662080,
    "freeSwapSpaceSize": 8447324160,
    "maxFileDescriptorCount": 1000000,
    "openFileDescriptorCount": 191,
    "processCpuTime": 252980000000,
    "systemLoadAverage": 83.0,
    "totalPhysicalMemorySize": 16756101120,
    "totalSwapSpaceSize": 8447324160
  },
  "runtimeStats": {
    "availableProcessors": 12,
    "freeMemory": 135665432,
    "maxMemory": 3724541952,
    "totalMemory": 361234432,
    "uptime": 6894992,
    "usedMemory": 225569000
  },
  "nearCacheStats": {
    "CACHE": {
      "a-cache": {
        "creationTime": 1507874429719,
        "evictions": 0,
        "hits": 0,
        "misses": 50,
        "ownedEntryCount": 0,
        "expirations": 0,
        "ownedEntryMemoryCost": 0,
        "lastPersistenceDuration": 0,
        "lastPersistenceKeyCount": 0,
        "lastPersistenceTime": 0,
        "lastPersistenceWrittenBytes": 0,
        "lastPersistenceFailure": ""
      },
      "b.cache": {
        "creationTime": 1507874429973,
        "evictions": 0,
        "hits": 0,
        "misses": 50,
        "ownedEntryCount": 0,
        "expirations": 0,
        "ownedEntryMemoryCost": 0,
        "lastPersistenceDuration": 0,
        "lastPersistenceKeyCount": 0,
        "lastPersistenceTime": 0,
        "lastPersistenceWrittenBytes": 0,
        "lastPersistenceFailure": ""
      }
    },
    "MAP": {
      "other,map": {
        "creationTime": 1507874428638,
        "evictions": 0,
        "hits": 100,
        "misses": 50,
        "ownedEntryCount": 0,
        "expirations": 0,
        "ownedEntryMemoryCost": 0,
        "lastPersistenceDuration": 0,
        "lastPersistenceKeyCount": 0,
        "lastPersistenceTime": 0,
        "lastPersistenceWrittenBytes": 0,
        "lastPersistenceFailure": ""
      },
      "employee-map": {
        "creationTime": 1507874427959,
        "evictions": 0,
        "hits": 100,
        "misses": 50,
        "ownedEntryCount": 0,
        "expirations": 0,
        "ownedEntryMemoryCost": 0,
        "lastPersistenceDuration": 0,
        "lastPersistenceKeyCount": 0,
        "lastPersistenceTime": 0,
        "lastPersistenceWrittenBytes": 0,
        "lastPersistenceFailure": ""
      }
    }
  },
  "userExecutorQueueSize": 0,
  "memberConnection": "ALL",
  "version": "UNKNOWN"
}
20. Clustered JMX via Management Center
Hazelcast IMDG Enterprise
Clustered JMX via Management Center allows you to monitor clustered statistics of distributed objects from a JMX interface.
20.1. Configuring Clustered JMX
In order to configure Clustered JMX, use the following command line parameters for your Management Center deployment.
-
-Dhazelcast.mc.jmx.enabled=true(default is false) -
-Dhazelcast.mc.jmx.port=9000(optional, default is 9999) -
-Dcom.sun.management.jmxremote.ssl=false -
-Dhazelcast.mc.jmx.rmi.port=9001(optional, default is 9998) -
-Dhazelcast.mc.jmx.host=localhost(optional, default is server’s host name)
With embedded Jetty, you do not need to deploy your Management Center application to any container or application server.
You can start the Management Center application with Clustered JMX enabled as shown below.
java -Dhazelcast.mc.jmx.enabled=true
-Dhazelcast.mc.jmx.port=9999
-Dcom.sun.management.jmxremote.ssl=false -jar hazelcast-mancenter-3.12.15.war
Once the Management Center starts, you should see a log similar to the one below:
INFO: Management Center 3.3
Jun 05, 2014 11:55:32 AM com.hazelcast.webmonitor.service.jmx.impl.JMXService
INFO: Starting Management Center JMX Service on port :9999
You should be able to connect to the Clustered JMX interface
using the address localhost:9999.
You can use jconsole or any other JMX client to monitor your
Hazelcast IMDG cluster. As an example, below is the jconsole
screenshot of the Clustered JMX hierarchy.
20.1.1. Enabling TLS/SSL for Clustered JMX
By default, Clustered JMX is served unencrypted. To enable TLS/SSL for Clustered JMX, use the following command line parameters for your Management Center deployment:
-
-Dhazelcast.mc.jmx.ssl=true(default is false) -
-Dhazelcast.mc.jmx.ssl.keyStore=path to your keystore -
-Dhazelcast.mc.jmx.ssl.keyStorePassword=password for your keystore
The following is an example on how to start the Management Center with a TLS/SSL enabled Clustered JMX service on port 65432:
java -Dhazelcast.mc.jmx.enabled=true
-Dhazelcast.mc.jmx.port=65432
-Dhazelcast.mc.jmx.ssl=true
-Dhazelcast.mc.jmx.ssl.keyStore=/some/dir/selfsigned.jks
-Dhazelcast.mc.jmx.ssl.keyStorePassword=yourpassword -jar hazelcast-mancenter-3.12.15.war| You can encrypt the keystore password and pass it as a command line argument in encrypted form for improved security. See the Variable Replacers section for more information. |
Then, you can use the following command to connect to the
Clustered JMX service using JConsole with the address localhost:65432:
jconsole -J-Djavax.net.ssl.trustStore=/some/dir/selftrusted.ts -J-Djavax.net.ssl.trustStorePassword=trustpassAdditional TLS/SSL Configuration Options
The following are some additional command line arguments that you can use to configure TLS/SSL for clustered JMX:
-
-Dhazelcast.mc.jmx.ssl.keyStoreType: Type of the keystore. Its default value is JKS. -
-Dhazelcast.mc.jmx.ssl.keyManagerAlgorithm: Name of the algorithm based on which the authentication keys are provided. The system default is used if none is provided. You can find out the default by calling thejavax.net.ssl.KeyManagerFactory#getDefaultAlgorithmmethod.
20.2. Clustered JMX API
The management beans are exposed with the following object name format:
ManagementCenter[`*cluster name*`]:type=<`*object type*`>,name=<`*object name*`>,member="<`*cluster member IP address*`>"The object name starts with the ManagementCenter prefix. Then it has
the cluster name in brackets followed by a colon. After that, type,
name and member attributes follow, each separated with a comma.
-
typeis the type of object. Values areClients,Executors,Maps,Members,MultiMaps,Queues,Counters,Services, andTopics. -
nameis the name of object. -
memberis the member address of object (only required if the statistics are local to the member).
A sample bean is shown below.
ManagementCenter[dev]:type=Services,name=OperationService,member="192.168.2.79:5701"Here is the list of attributes that are exposed from the Clustered JMX interface.
-
ManagementCenter
-
ManagementCenter
-
LicenseExpirationTime
-
Clusters
-
-
ManagementCenter[
<ClusterName>] -
<ClusterName>-
MasterAddress
-
LicenseExpirationTime
-
-
ClientStats
-
<Client UUID>-
HeapUsedMemory
-
HeapFreeMemory
-
HeapMaxMemory
-
HeapTotalMemory
-
ClientName
-
AvailableProcessors
-
Uptime
-
Enterprise
-
MemberConnection
-
ClusterConnectionTimestamp
-
LastStatisticsCollectionTime
-
UserExecutorQueueSize
-
CommittedVirtualMemorySize
-
FreePhysicalMemorySize
-
FreeSwapSpaceSize
-
MaxFileDescriptorCount
-
OpenFileDescriptorCount
-
ProcessCpuTime
-
SystemLoadAverage
-
TotalPhysicalMemorySize
-
TotalSwapSpaceSize
-
Version
-
Address
-
Type
-
CACHE
-
<Cache Name>-
Evictions
-
Expirations
-
Hits
-
Misses
-
OwnedEntryCount
-
OwnedEntryMemoryCost
-
LastPersistenceDuration
-
LastPersistenceKeyCount
-
LastPersistenceTime
-
LastPersistenceWrittenBytes
-
LastPersistenceFailure
-
CreationTime
-
-
-
MAP
-
<Map Name>-
Evictions
-
Expirations
-
Hits
-
Misses
-
OwnedEntryCount
-
OwnedEntryMemoryCost
-
LastPersistenceDuration
-
LastPersistenceKeyCount
-
LastPersistenceTime
-
LastPersistenceWrittenBytes
-
LastPersistenceFailure
-
CreationTime
-
-
-
-
-
Clients
-
<Client Address>-
Address
-
CanonicalHostName
-
ClientName
-
ClientType
-
IpAddress
-
Labels
-
Uuid
-
-
-
Executors
-
<Executor Name>-
Cluster
-
Name
-
StartedTaskCount
-
CompletedTaskCount
-
CancelledTaskCount
-
PendingTaskCount
-
-
-
Maps
-
<Map Name>-
Cluster
-
Name
-
BackupEntryCount
-
BackupEntryMemoryCost
-
CreationTime
-
DirtyEntryCount
-
Events
-
GetOperationCount
-
HeapCost
-
Hits
-
LastAccessTime
-
LastUpdateTime
-
LockedEntryCount
-
MaxGetLatency
-
MaxPutLatency
-
MaxRemoveLatency
-
OtherOperationCount
-
OwnedEntryCount
-
PutOperationCount
-
RemoveOperationCount
-
AvgGetLatency
-
AvgPutLatency
-
AvgRemoveLatency
-
-
-
ReplicatedMaps
-
<Replicated Map Name>-
Cluster
-
Name
-
BackupEntryCount
-
BackupEntryMemoryCost
-
CreationTime
-
DirtyEntryCount
-
Events
-
GetOperationCount
-
HeapCost
-
Hits
-
LastAccessTime
-
LastUpdateTime
-
LockedEntryCount
-
MaxGetLatency
-
MaxPutLatency
-
MaxRemoveLatency
-
OtherOperationCount
-
OwnedEntryCount
-
PutOperationCount
-
RemoveOperationCount
-
AvgGetLatency
-
AvgPutLatency
-
AvgRemoveLatency
-
-
-
Members
-
<Member Address>-
Uuid
-
CpMemberUuid
-
ConnectedClientCount
-
HeapFreeMemory
-
HeapMaxMemory
-
HeapTotalMemory
-
HeapUsedMemory
-
IsMaster
-
OwnedPartitionCount
-
-
-
MultiMaps
-
<MultiMap Name>-
Cluster
-
Name
-
BackupEntryCount
-
BackupEntryMemoryCost
-
CreationTime
-
DirtyEntryCount
-
Events
-
GetOperationCount
-
HeapCost
-
Hits
-
LastAccessTime
-
LastUpdateTime
-
LockedEntryCount
-
MaxGetLatency
-
MaxPutLatency
-
MaxRemoveLatency
-
OtherOperationCount
-
OwnedEntryCount
-
PutOperationCount
-
RemoveOperationCount
-
AvgGetLatency
-
AvgPutLatency
-
AvgRemoveLatency
-
-
-
Queues
-
<Queue Name>-
Cluster
-
Name
-
MinAge
-
MaxAge
-
AvgAge
-
OwnedItemCount
-
BackupItemCount
-
OfferOperationCount
-
OtherOperationsCount
-
PollOperationCount
-
RejectedOfferOperationCount
-
EmptyPollOperationCount
-
EventOperationCount
-
CreationTime
-
-
-
Counters
-
<Counter Name>-
Cluster
-
Name
-
ReplicaCount
-
Time
-
OpsPerSecInc (for each member)
-
OpsPerSecDec (for each member)
-
Value (for each member)
-
-
-
Services
-
ConnectionManager
-
ActiveConnectionCount
-
ClientConnectionCount
-
ConnectionCount
-
-
EventService
-
EventQueueCapacity
-
EventQueueSize
-
EventThreadCount
-
-
OperationService
-
ExecutedOperationCount
-
OperationExecutorQueueSize
-
OperationThreadCount
-
RemoteOperationCount
-
ResponseQueueSize
-
RunningOperationsCount
-
-
PartitionService
-
ActivePartitionCount
-
PartitionCount
-
-
ProxyService
-
ProxyCount
-
-
ManagedExecutor[hz::async]
-
Name
-
CompletedTaskCount
-
MaximumPoolSize
-
PoolSize
-
QueueSize
-
RemainingQueueCapacity
-
Terminated
-
-
ManagedExecutor[hz::client]
-
Name
-
CompletedTaskCount
-
MaximumPoolSize
-
PoolSize
-
QueueSize
-
RemainingQueueCapacity
-
Terminated
-
-
ManagedExecutor[hz::global-operation]
-
Name
-
CompletedTaskCount
-
MaximumPoolSize
-
PoolSize
-
QueueSize
-
RemainingQueueCapacity
-
Terminated
-
-
ManagedExecutor[hz::io]
-
Name
-
CompletedTaskCount
-
MaximumPoolSize
-
PoolSize
-
QueueSize
-
RemainingQueueCapacity
-
Terminated
-
-
ManagedExecutor[hz::query]
-
Name
-
CompletedTaskCount
-
MaximumPoolSize
-
PoolSize
-
QueueSize
-
RemainingQueueCapacity
-
Terminated
-
-
ManagedExecutor[hz::scheduled]
-
Name
-
CompletedTaskCount
-
MaximumPoolSize
-
PoolSize
-
QueueSize
-
RemainingQueueCapacity
-
Terminated
-
-
ManagedExecutor[hz::system]
-
Name
-
CompletedTaskCount
-
MaximumPoolSize
-
PoolSize
-
QueueSize
-
RemainingQueueCapacity
-
Terminated
-
-
-
Topics
-
<Topic Name>-
Cluster
-
Name
-
CreationTime
-
PublishOperationCount
-
ReceiveOperationCount
-
-
-
FlakeIdGenerators
-
<Generator Name>-
Cluster
-
Name
-
Time
-
OpsPerSec (per member)
-
-
-
WanConfigs
-
<Wan Replication Config>-
Cluster
-
Name
-
TargetGroupSet
-
getTime(
<Publisher ID>) -
getOutboundQueueSize(
<Publisher ID>) -
getMaxOutboundQueueSize(
<Publisher ID>) -
getTotalPublishedEventCount(
<Publisher ID>) -
getTotalPublishLatency(
<Publisher ID>)
-
-
20.3. Integrating with New Relic
Use the Clustered JMX interface to integrate the Hazelcast Management Center with New Relic. To perform this integration, attach the New Relic Java agent and provide an extension file that describes which metrics will be sent to New Relic.
See Custom JMX instrumentation by YAML on the New Relic webpage.
The following is an example Map monitoring .yml file for New Relic:
name: Clustered JMX
version: 1.0
enabled: true

jmx:
- object_name: ManagementCenter[clustername]:type=Maps,name=mapname
  metrics:
  - attributes: PutOperationCount, GetOperationCount, RemoveOperationCount, Hits, BackupEntryCount, OwnedEntryCount, LastAccessTime, LastUpdateTime
  - type: simple
- object_name: ManagementCenter[clustername]:type=Members,name="member address in double quotes"
  metrics:
  - attributes: OwnedPartitionCount
  - type: simple
Put the .yml file in the extensions directory in your New Relic
installation. If an extensions directory does not exist there, create one.
After you set your extension, attach the New Relic Java agent and start the Management Center as shown below.
java -javaagent:/path/to/newrelic.jar -Dhazelcast.mc.jmx.enabled=true\
    -Dhazelcast.mc.jmx.port=9999 -jar hazelcast-mancenter-3.12.15.war
If your logging level is set to FINER, you should see the log listing
in the file newrelic_agent.log, which is located in the logs directory
in your New Relic installation. The following is an example log listing:
Jun 5, 2014 14:18:43 +0300 [72696 62] com.newrelic.agent.jmx.JmxService FINE:
    JMX Service : querying MBeans (1)
Jun 5, 2014 14:18:43 +0300 [72696 62] com.newrelic.agent.jmx.JmxService FINER:
    JMX Service : MBeans query ManagementCenter[dev]:type=Members,
    name="192.168.2.79:5701", matches 1
Jun 5, 2014 14:18:43 +0300 [72696 62] com.newrelic.agent.jmx.JmxService FINER:
    Recording JMX metric OwnedPartitionCount : 68
Jun 5, 2014 14:18:43 +0300 [72696 62] com.newrelic.agent.jmx.JmxService FINER:
    JMX Service : MBeans query ManagementCenter[dev]:type=Maps,name=orders,
    matches 1
Jun 5, 2014 14:18:43 +0300 [72696 62] com.newrelic.agent.jmx.JmxService FINER:
    Recording JMX metric Hits : 46,593
Jun 5, 2014 14:18:43 +0300 [72696 62] com.newrelic.agent.jmx.JmxService FINER:
    Recording JMX metric BackupEntryCount : 1,100
Jun 5, 2014 14:18:43 +0300 [72696 62] com.newrelic.agent.jmx.JmxService FINER:
    Recording JMX metric OwnedEntryCount : 1,100
Jun 5, 2014 14:18:43 +0300 [72696 62] com.newrelic.agent.jmx.JmxService FINER:
    Recording JMX metric RemoveOperationCount : 0
Jun 5, 2014 14:18:43 +0300 [72696 62] com.newrelic.agent.jmx.JmxService FINER:
    Recording JMX metric PutOperationCount : 118,962
Jun 5, 2014 14:18:43 +0300 [72696 62] com.newrelic.agent.jmx.JmxService FINER:
    Recording JMX metric GetOperationCount : 0
Jun 5, 2014 14:18:43 +0300 [72696 62] com.newrelic.agent.jmx.JmxService FINER:
    Recording JMX metric LastUpdateTime : 1,401,962,426,811
Jun 5, 2014 14:18:43 +0300 [72696 62] com.newrelic.agent.jmx.JmxService FINER:
    Recording JMX metric LastAccessTime : 1,401,962,426,811
Then you can navigate to your New Relic account and create Custom Dashboards. See Creating custom dashboards.
While you are creating the dashboard, you should see the metrics that you are sending to New Relic from the Management Center in the Metrics section under the JMX directory.
20.4. Integrating with AppDynamics
Use the Clustered JMX interface to integrate the Hazelcast Management Center with AppDynamics. To perform this integration, attach the AppDynamics Java agent to the Management Center.
For agent installation, see the Install the App Agent for Java page.
For monitoring on AppDynamics, see the Using AppDynamics for JMX Monitoring page.
After installing AppDynamics agent, you can start the Management Center as shown below:
java -javaagent:/path/to/javaagent.jar -Dhazelcast.mc.jmx.enabled=true\
    -Dhazelcast.mc.jmx.port=9999 -jar hazelcast-mancenter-3.12.15.war
When the Management Center starts, you should see the logs below:
Started AppDynamics Java Agent Successfully.
Hazelcast Management Center starting on port 8080 at path : /hazelcast-mancenter
21. Management Center Configuration Tool
The Management Center Configuration Tool (MC-Conf) is a command
line tool that allows you to update certain parts of the Management Center
configuration by using its built-in commands. You can use the mc-conf.sh
or mc-conf.bat script to run the MC-Conf tool.
| You must run the MC-Conf tool on the same machine where the Management Center web application is deployed. |
21.1. Built-In Help
In order to see all available commands, run the MC-Conf script with no arguments as shown below.
./mc-conf.shAs the result, you should see an output similar to below.
Hazelcast Management Center Configuration Tool 3.12
Usage: mc-conf [-hV] [COMMAND]
Command line tool for interacting with Hazelcast Management Center
configuration.

Global options are:
-h, --help      Show this help message and exit.
-V, --version   Print version information and exit.

Commands:
create-user
           Create a new user record in the default security
           provider.
           *Important notice:* Make sure that Management Center
                    web application is stopped (offline) before
                    starting this command.

change-user-password
           Change password for the given user record in the
           default security provider.
           *Important notice:* Make sure that Management Center
                    web application is stopped (offline) before
                    starting this command.

update-ldap-password
           Update LDAP service user's password that is stored
           in a Java keystore.

reset-security-provider
           Reset current security provider and delete all
           built-in user records in the default security
           provider.
           *Important notice:* Make sure that Management Center
                     web application is stopped (offline) before
                     starting this command.
You can also get help for any command by using the -h (or --help)
command line option. See the following example:
$ ./mc-conf.sh create-user -h
Usage: mc-conf create-user [-hvV] [--password:sec=<passwordSec>] [-H=<homedir>]
                           -n=<username> [-p=<password>] -r=<role>

            Create a new user record in the default security provider.
            *Important notice:* Make sure that the Management Center web application is stopped
                                (offline) before starting this command.

-H, --home=<homedir>
            Optional path to the Management Center home directory. By
            default ~/hazelcast-mc/ is used.
-n, --username=<username>
            Username for the user record.
-p, --password=<password>
            Password for the user record.
    --password:sec=<passwordSec>
            Password for the user record (a secure alternative to
            --password, with interactive prompt).
-r, --role=<role>
            Roles for the user record. Valid values: readonly,
            readwrite, metricsonly, admin.
-h, --help
            Show this help message and exit.
-V, --version
            Print version information and exit.
-v, --verbose
            Show logs from the Management Center and full stack trace of
            errors.
21.2. Creating Users
The create-user command creates a new user in the default security
provider. Note that you must stop the Management Center web application
before running this command.
You can use this command for various scripting purposes. See the Hazelcast Docker Code Samples repository for an example of Docker image for the Management Center container with a built-in user account.
If you have used a non-default Management Center home directory location,
you must provide the path to the home directory with the -H (or --home) option.
|
21.3. Changing User Password
The change-user-password command resets the password of a specified user in
the default security provider. Note that you must stop the Management Center
web application before running this command.
You can use this command as a recovery mechanism for the Management Center’s administrator user account.
If you have used a non-default Management Center home directory location,
you must provide the path to the home directory with the -H (or --home) option.
|
21.4. Updating LDAP Password
The update-ldap-password command updates the encrypted LDAP password stored in
the keystore. It expects information about the keystore such as its location and
password and the new LDAP password that you want to use. See the
LDAP Authentication section for more information on the
encrypted LDAP passwords. After updating the LDAP password, you need to click
on the Reload Security Config button on the login page.
21.5. Resetting Security Provider
The reset-security-provider command resets current security provider used in
the Management Center. For the default security provider it also deletes all
built-in user accounts. Note that you must stop the Management Center web application
before running this command.
You can use this command as a recovery mechanism for the Management Center deployment
in case if a non-default security provider is configured. In case of the default security
provider, you can also use the create-user or change-user-password
commands as the recovery mechanism.
If you have used a non-default Management Center home directory location, you must
provide the path to the home directory with the -H (or --home) option.
|
21.6. Configuring Time Travel
The configure-time-travel command enables or disables time travel for Management Center.
When enabled, Management Center persists metrics that it has received from the cluster
to the local disk.
If you have used a non-default Management Center home directory location, you must
provide the path to the home directory with the -H (or --home) option.
|
21.7. Advanced Features
MC-Conf supports interactive options for secure processing of passwords. Those options
are listed in the built-in help and have a :sec suffix in their names. When you use
such option instead of a regular one, you will get a prompt to enter a value on the
console. An example of the interactive option usage is shown below.
$ ./mc-conf.sh change-user-password --username=admin --password:sec
Enter value for --password:sec (Password for the user record (a secure alternative
to --password, with interactive prompt).): ********
Successfully changed password for user 'admin'.
As you see in the above example, the password input is not echoed to the console
since it is provided with the :sec suffix in the command.
Another advanced feature of MC-Conf is the support for argument files. When an
argument beginning with the character @ is encountered, it is treated as a path
leading to a text file. The contents of that file are automatically expanded into
the current command. An example of the argument file usage is shown below.
$ ./mc-conf.sh change-user-password @arg-file.txt
Successfully changed password for user 'admin'.
$ cat arg-file.txt
--username=admin --password=mnb3c4s0
22. Phone Home
Hazelcast uses phone home data to learn about usage of Hazelcast Management Center.
Hazelcast Management Center instances initially call our phone home server 30 minutes after they are started and once every 24 hours thereafter.
What is sent in?
The following information is sent in a phone home:
-
Hazelcast Management Center version
-
Authentication provider used (Default, LDAP, ActiveDirectory, JAAS)
-
Whether clustered REST is enabled or not
-
Whether clustered JMX is enabled or not
-
Whether TLS is enabled or not
-
If TLS is enabled, whether mutual authentication is enabled or not
-
-
Whether Management Center is deployed on an application server or used in standalone mode
-
If not in standalone mode, type of the application server
-
-
Number of users (if the default security provider is used)
-
Number of clusters
-
Management Center uptime
-
Minimum and maximum cluster sizes
-
Minimum and maximum cluster versions
-
Total number of members
-
Size of the Hazelcast Management Center home directory
-
Hash value of Hazelcast Management Center license key
-
Environment Information:
-
Name of operating system
-
Version of installed Java
-
For each user login, we store the following information and send it in a phone home:
-
Browser (Chrome, Firefox, IE etc.)
-
Browser major version
-
Operating system
-
Operating system version
-
Screen height and width
-
Window height and width
Disabling Phone Homes
Set the hazelcast.mc.phone.home.enabled system property to false on the Java command line.
Phone Home URL
http://phonehome.hazelcast.com/pingMc
23. Management Center Documentation
To see the Management Center documentation (this Reference Manual), click on the Documentation button located at the toolbar. This Management Center manual appears as a tab.
24. Configuring the maximum cache size
You can configure the maximum size of the cache containing timestamped cluster states using the
hazelcast.mc.cache.max.size system property. This value is 768 by default. Decreasing this limit can
significantly lower the heap usage of Management Center in cases when the cluster contains a lot of maps.
24.1. Approximate heap usages
The tables below list reference data about the heap usage of Management Center, depending on the cluster member
count, map count in each member, and hazelcast.mc.cache.max.size setting.
hazelcast.mc.cache.max.size |
2,000 maps | 4,000 maps | 6,000 maps |
|---|---|---|---|
256 |
440 Mb |
810 Mb |
1,170 Mb |
512 |
800 Mb |
1,530 Mb |
2,260 Mb |
768 |
1,150 Mb |
2,240 Mb |
3,320 Mb |
hazelcast.mc.cache.max.size |
2,000 maps | 4,000 maps | 6,000 maps |
|---|---|---|---|
256 |
1,750 Mb |
3,560 Mb |
5,290 Mb |
512 |
3,530 Mb |
6,960 Mb |
10,030 Mb |
768 |
4,340 Mb |
9,770 Mb |
When the cluster has a lot of connected clients (especially with Near Caches) or the number of other data structures is significant, these will consume additional heap space. In this case, you need to adjust hazelcast.mc.cache.max.size accordingly. The above reference numbers were taken by benchmarking a cluster with no clients and no distributed objects other than maps.
|
In cases when adjusting hazelcast.mc.cache.max.size is not sufficient, you may consider turning off statistics collection for some of your distributed objects with their respective "statistics-enabled" configuration settings, so that Management Center stores less data in-memory.
|
It is not recommended to change the cache size unless the cluster has a large number of distributed data structures which may cause Management Center to run out of heap memory.
Setting too low a value for hazelcast.mc.cache.max.size can be detrimental to the level of detail shown within Management Center, especially when it comes to graphs.
Appendix A: Migration Guides
This appendix provides information on compatibility related changes for Hazelcast Management Center releases.
A.1. Hazelcast Management Center 3.12.x
-
Default home directory location has been changed from
<user-home>/hazelcast-mancenter-<version>to<user-home>/hazelcast-mc. -
Parameter to change home directory location has been changed from
hazelcast.mancenter.hometohazelcast.mc.home. -
The
UpdateLdapPasswordutility (available viaupdateLdapPassword.shorupdateLdapPassword.batscripts) has been merged into the MC Conf tool (available via themc-conf.shormc-conf.batscripts).
A.2. Hazelcast Management Center 3.10.x
-
Hazelcast Management Center’s default URL has been changed from
localhost:8080/mancentertolocalhost:8080/hazelcast-mancenter. -
Default home directory location has been changed from
<user-home>/mancenter-<version>to<user-home>/hazelcast-mancenter-<version>. -
Name of the WAR file has been changed from
mancenter-{version}.wartohazelcast-mancenter-{version}.war.
A.3. Hazelcast Management Center 3.8.x
Starting with Management Center 3.8.4, you can use the following system properties for Clustered JMX via Management Center:
-
-Dhazelcast.mc.jmx.rmi.port=9001 -
-Dhazelcast.mc.jmx.host=localhost
Appendix B: Automated Security Scanning
When you scan Management Center artifacts, your tool might warn you about the following vulnerabilities. Management Center security is not affected by them as it doesn’t use the affected features.
Management Center security is not affected by the following H2DB vulnerabilities as it uses a custom version of H2DB which is patched against these vulnerabilities.