
Hazelcast Jet Management Center Reference Manual
Version 3.2.2
Welcome to the Hazelcast Jet Management Center Manual. This manual includes information on how to use Hazelcast Jet Management Center.
Hazelcast Jet Management Center enables you to monitor and manage your cluster members running Hazelcast Jet. In addition to monitoring the overall state of your clusters, you can also analyze and troubleshoot your pipelines in detail and manage their lifecycle.
Summary of Contents
-
Get Started leads you through the steps to get Hazelcast Jet Management Center up and running on your machine.
-
Configuration explains how to configure Hazelcast Jet Management Center. You can configure licensing, the underlying Hazelcast Jet Client, security, etc.
-
User Interface Overview explains the user interface of the Hazelcast Jet Management Center.
1. Get Started
In this section we’ll get you started using Hazelcast Jet Management Center. We’ll show you how to set up a running instance of Hazelcast Jet Management Center.
1.1. Requirements
| You need Java Runtime Environment 1.8 or later for running Hazelcast Jet Management Center. |
1.2. Starting the Hazelcast Jet Management Center
You can start the Hazelcast Jet Management Center from the command line using the bundled starter scripts.
Here are the steps.
-
Unpack the received Hazelcast Jet Management Center ZIP distribution. The ZIP archive contains the
jet-management-center.shandjet-management-center.batfiles under the directoryhazelcast-jet-management-center-3.2.2. Those scripts can be used to start Hazelcast Jet Management Center file from the command line. -
Run the appropriate script for your operating system without any arguments to start Hazelcast Jet Management Center with default configuration like the following.
./jet-management-center.shor
./jet-management-center.batIt will start the application on port 8081(http://localhost:8081/).
Refer to the configuration section to provide more options when starting the application.
1.3. Licensing
Hazelcast Jet Management Center can be used without a license if the cluster that you want to monitor has at most 1 members.
When starting Hazelcast Jet Management Center from the command line,
a license can be provided using the parameter -l or --license-key.
For example by using the command line parameter --license-key:
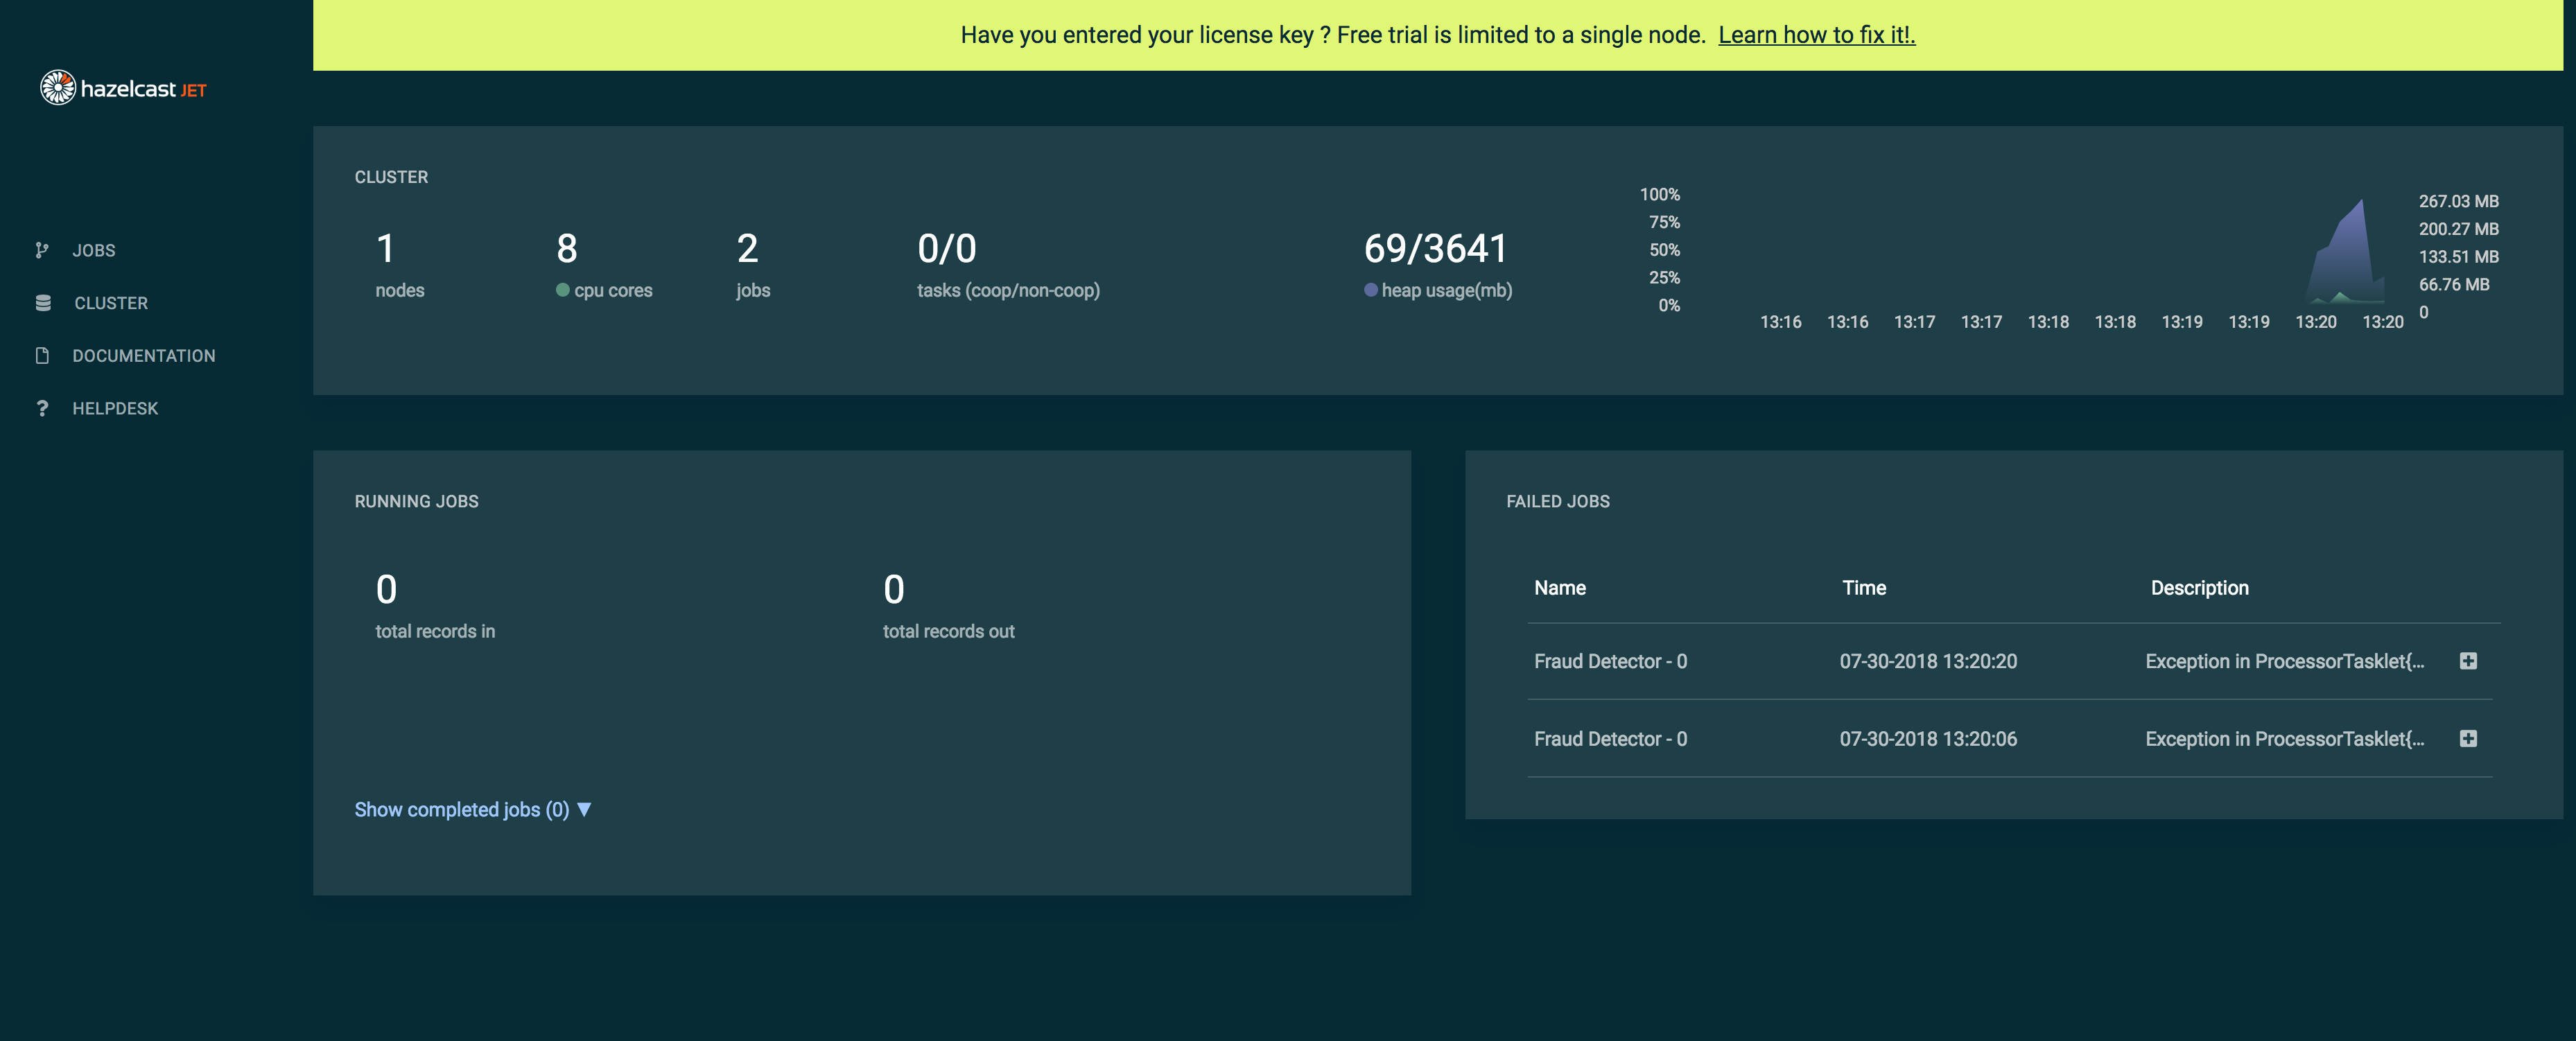
./jet-management-center.sh --license-key=YOUR_LICENSE_KEYWhen you try to connect to a cluster that has more than 2 members without entering a license key or if your license key is expired, the following warning message is shown at the top.
2. Configuration
Hazelcast Jet Management Center can be configured via command line parameters or configuration files. Then Hazelcast Jet Management Center will connect to your cluster to start monitoring.
If you’d like more control over how Hazelcast Jet Management Center should interact with your cluster, then you can provide a fully-featured Hazelcast Jet Client configuration file to Hazelcast Jet Management Center.
2.1. Configuration via command-line interface
The list of parameters supported by the command-line interface can be seen below.
$ ./jet-management-center.sh --help
Hazelcast Jet Management Center 3.0
Usage: hazelcast-jet-management-center [-hV] [-c=<path-to-client-config>]
                                       [-f=<path-to-application-config>]
                                       [-l=<license-key>] [-p=<port>]
                                       [-P=<password>] [-S=<password-secure>]
                                       [-U=<username>]
Utility for starting the Hazelcast Jet Management Center application

Global options are:

  -h, --help              Show this help message and exit.
  -V, --version           Print version information and exit.
  -p, --port=<port>       Server Port
                            Default: 8081
  -l, --license-key=<license-key>
                          Hazelcast Jet Management Center License Key
  -c, --client-config=<path-to-client-config>
                          Optional path to a client config file
                            Default: hazelcast-client.xml
  -f, --application-config=<path-to-application-config>
                          Optional path to a properties file
                            Default: application.properties
  -U, --user=<username>   Username for the user
                            Default: admin
  -P, --password=<password>
                          Password for the user
                            Default: admin
  -S, --password:sec=<password-secure>
                          Password for the user (a secure alternative to
                          --password, with interactive prompt).
For example, to start Hazelcast Jet Management Center on port 8090 and use the supplied license key run the following:
./jet-management-center.sh --port=8090 --license-key=YOUR_LICENSE_KEY2.2. Configuration via Properties File
Hazelcast Jet Management Center can be configured via a properties file called
application.properties.
The ZIP packaging includes an application.properties file that you can
override the configuration properties.
The default content of the application.properties file can be seen below;
# path for client configuration file (yaml or xml)
jet.clientConfig=
# License key for management center
jet.licenseKey=

# How many seconds of data to retain for each metric
jet.metrics.retentionSecs=3600

# User Authentication Configuration
spring.security.user.name=admin
spring.security.user.password=admin

# Sever Configuration Options
# server.port: 8081

# SSL configuration options for the web server
# server.ssl.key-store: keystore.p12
# server.ssl.key-store-password: mypassword
# server.ssl.keyStoreType: PKCS12
# server.ssl.keyAlias: tomcat
If you have a properties file in a different path or with a different name,
then it could be passed via -f or --application-config parameter like the
following;
./jet-management-center.sh --application-config=/path/to/application/my-app.properties2.2.1. Configuring the Hazelcast Jet Client configuration files
You can pass a hazelcast-client.xml or hazelcast-client.yaml configuration
file, which should contain group and network details, to Hazelcast Jet Management
Center to able to connect to the Hazelcast Jet cluster.
An example configuration, looks like the following, contains information about the Hazelcast Jet Cluster:
<hazelcast-client xsi:schemaLocation="http://www.hazelcast.com/schema/client-config hazelcast-client-config-3.12.xsd"
                  xmlns="http://www.hazelcast.com/schema/client-config"
                  xmlns:xsi="http://www.w3.org/2001/XMLSchema-instance">
    <group>
        <name>jet</name>
    </group>
    <network>
    <cluster-members>
      <address>10.1.1.21</address>
      <address>10.1.1.22</address>
    </cluster-members>
    </network>
</hazelcast-client>
or
hazelcast-client:
  group:
    name: jet
  network:
    cluster-members:
      - 10.1.1.21
      - 10.1.1.22
After you’ve created the Hazelcast Jet Client configuration file,
then it can be passed to the Hazelcast Jet Management Center at
start-up time via -c or --client-config parameter like following:
./jet-management-center.sh --client-config=/path/to/client/config.xml2.3. Security Configuration
2.3.1. Secure communication with TLS/SSL
Please refer to the Hazelcast IMDG reference manual for how to configure Hazelcast Jet Client inside the Hazelcast Jet Management Center to use TLS/SSL while communicating with the Hazelcast Jet cluster.
2.3.2. Authentication
Basic username and password authentication with a single user can be configured on Hazelcast Jet Management Center to prevent unauthorized parties to achieve unexpected actions on the Hazelcast Jet Cluster.
The username and password can be configured via command-line interface like following;
./jet-management-center.sh --user=my-user --password=p4ssW0rDAlternatively, following properties are used to configure the username and
password in the application.properties file;
spring.security.user.name-
Name of the user. Default is
admin spring.security.user.password-
Password of the user. Default is
admin
3. User Interface Overview
When the application initially loaded login page appears as shown below.
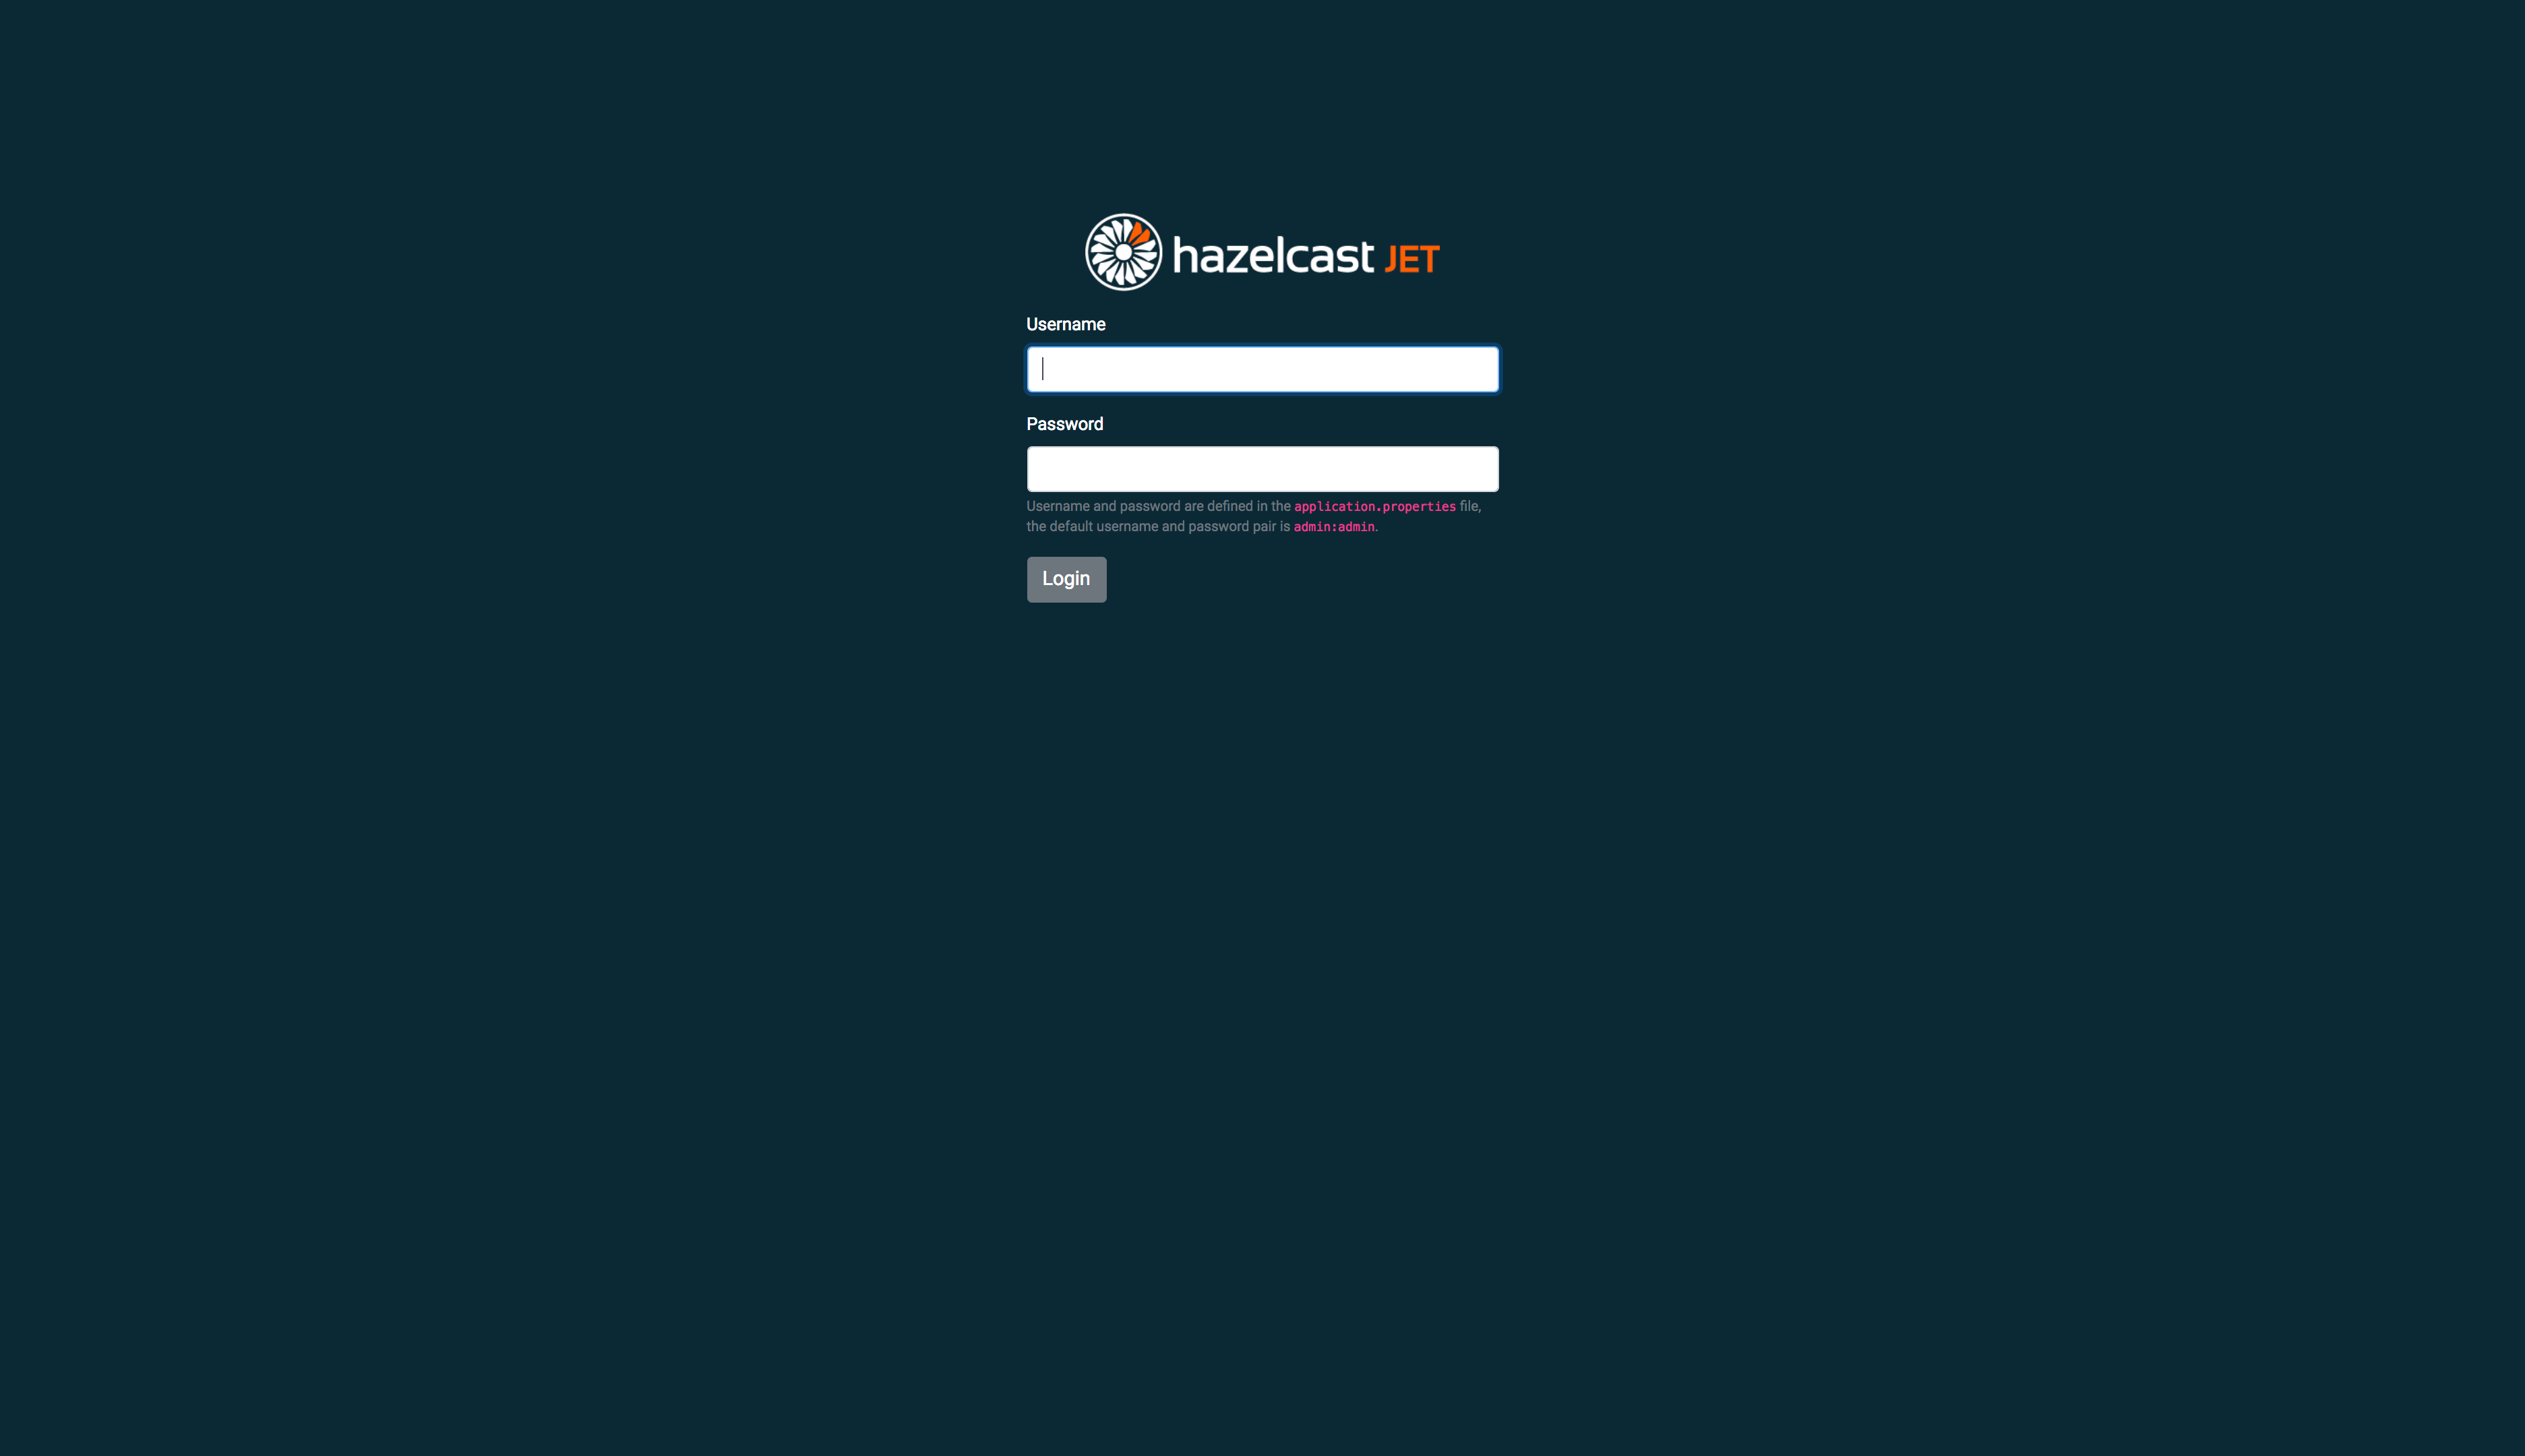
Upon successful login, user redirected to the Dashboard page which provides the fundamental information about the cluster and the jobs which are explained in detail in the Dashboard section.
3.1. Menu
The Application includes a menu on the left which acts as a main way of navigation between pages,

Below is the list of menu items with links to their explanations.
3.2. Connectivity Indicator
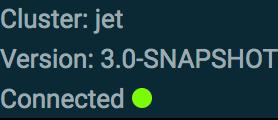
The Application includes a connectivity indicator on the bottom left, which shows connectivity status between Hazelcat Jet Management Center and Hazelcast Jet Cluster.
-
cluster: group name of the Hazelcast Jet cluster
-
version: version of the Hazelcast Jet cluster
-
status indicator: indicates whether connected to a Hazelcast Jet cluster or not.
3.3. Dashboard
Main dashboard provides general overview of the state of the Hazelcast Jet cluster and jobs.
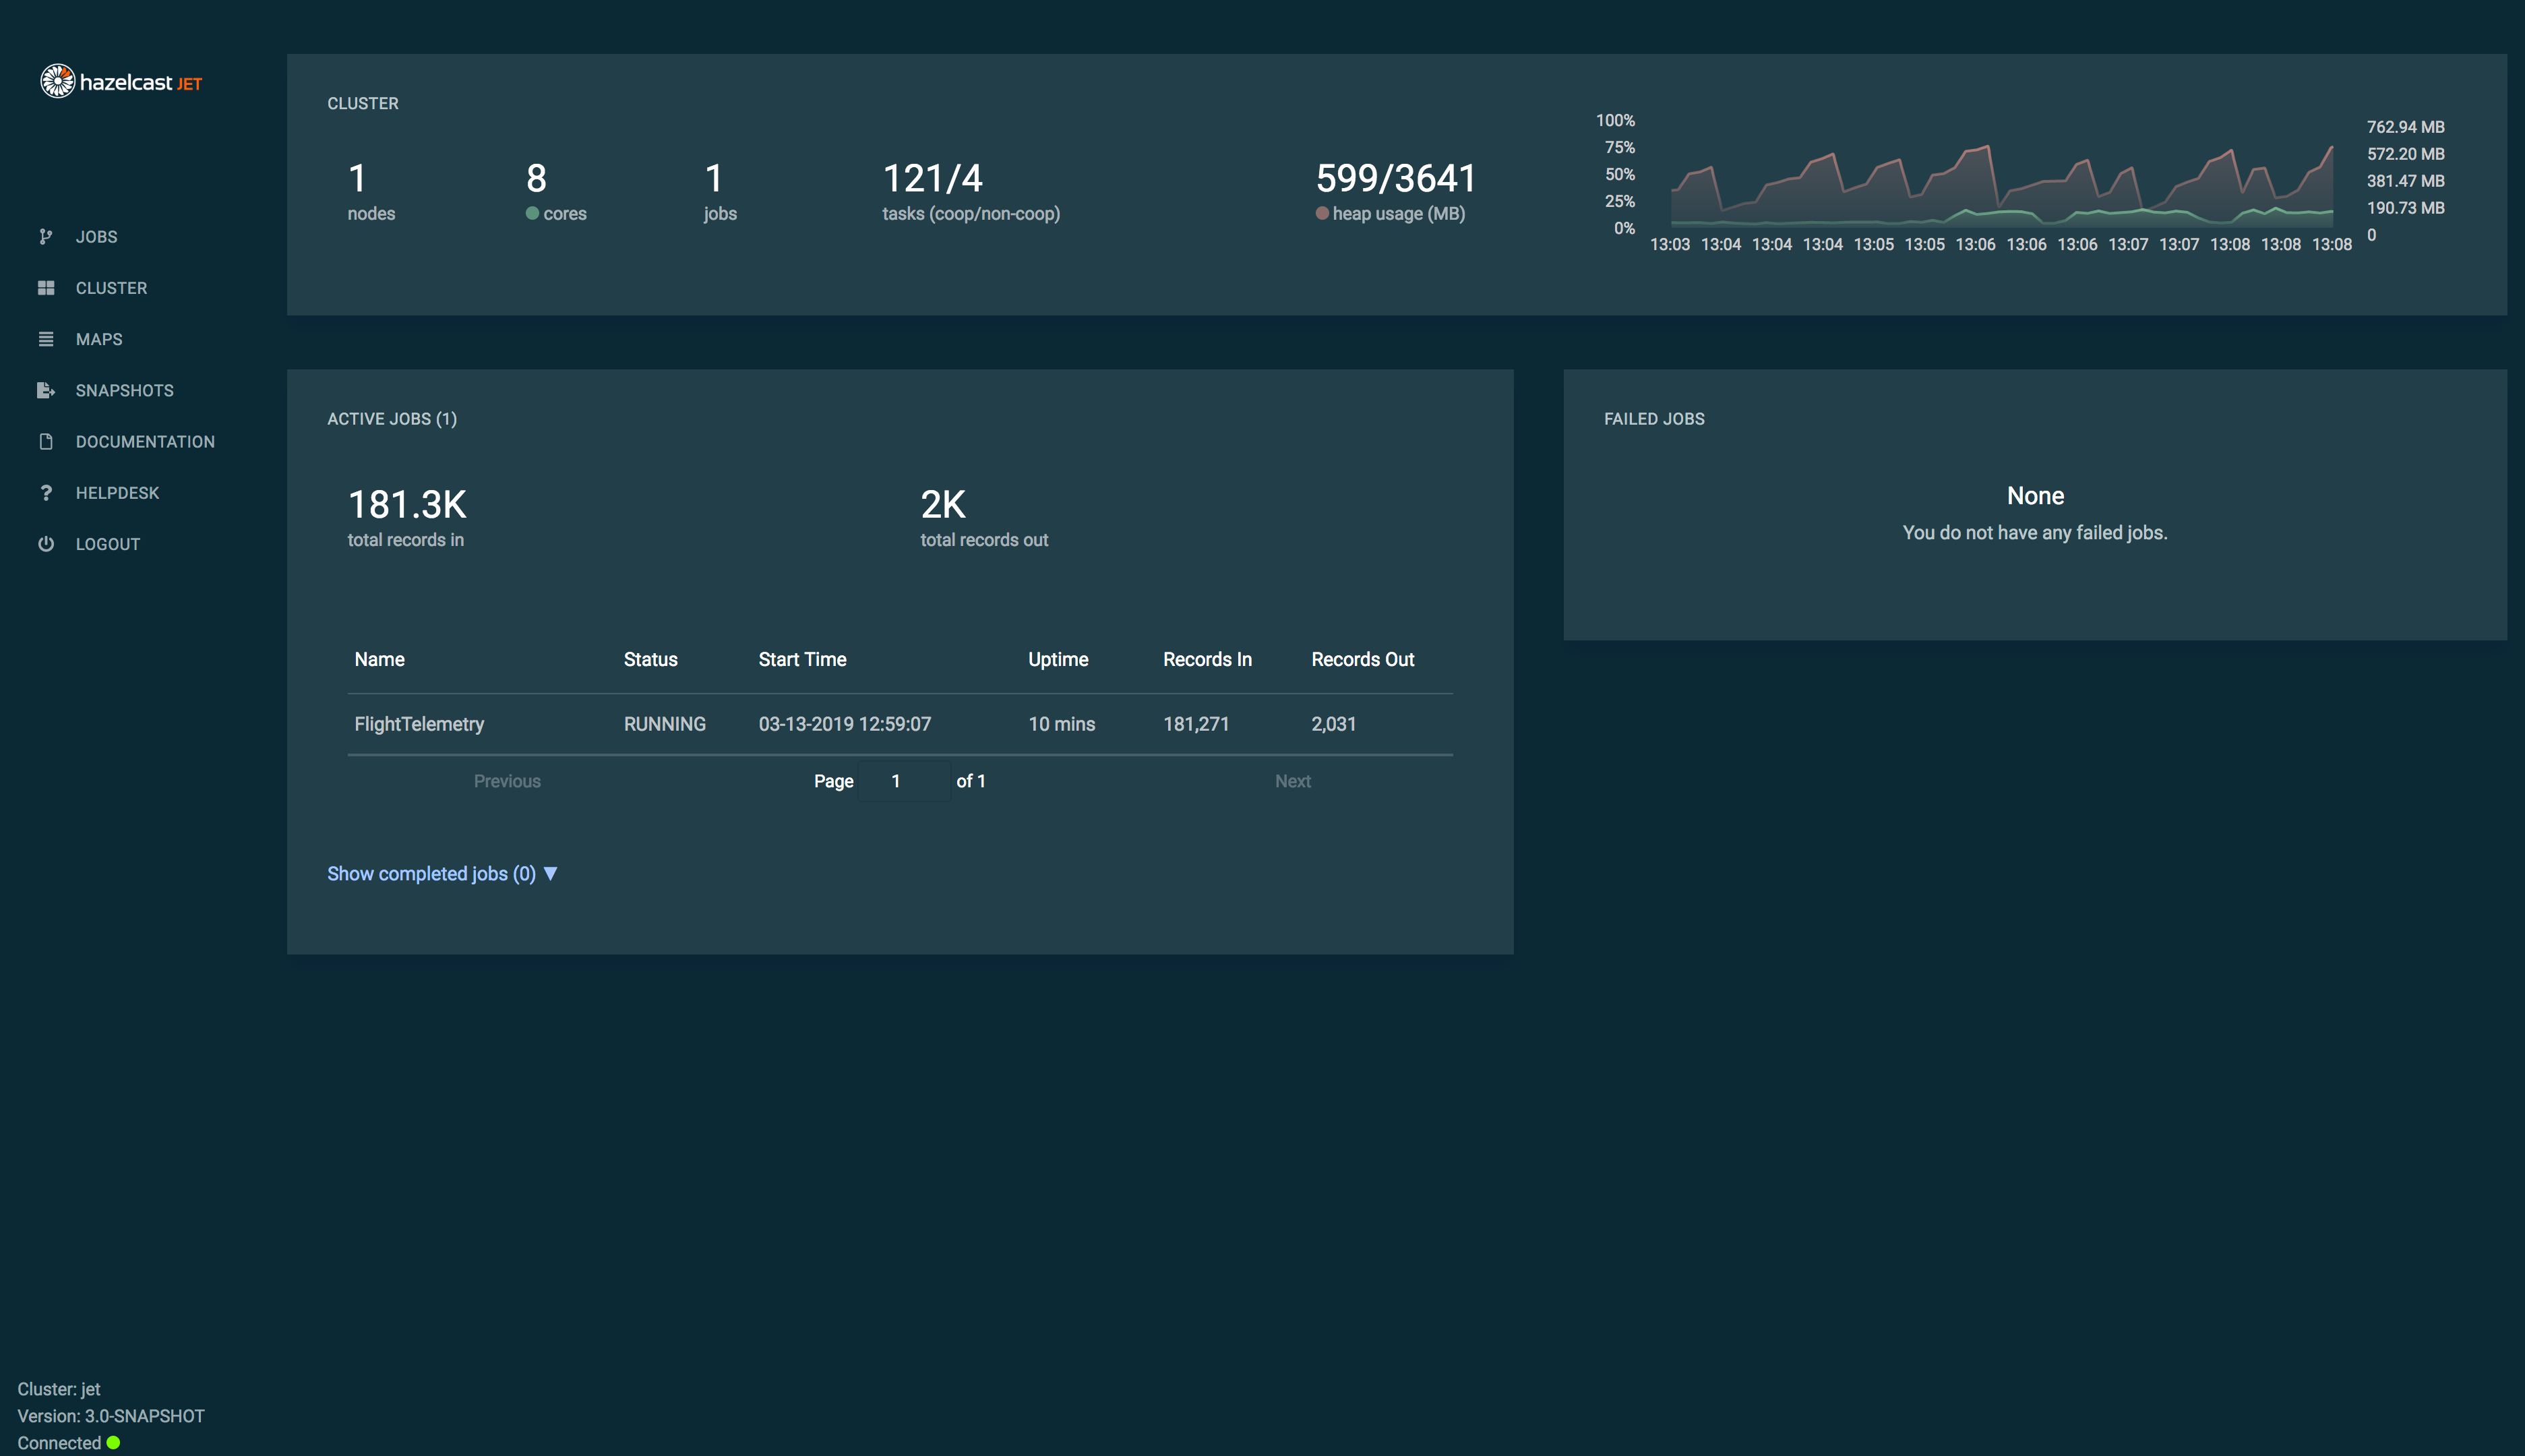
The metrics you can observe on this screen are listed below;
- Cluster Summary
-
Shows a summary of the cluster by providing following metrics;
-
nodes: number of nodes in the cluster
-
cpu cores: number of available cpu cores in the cluster reported by the JVM
-
jobs: number of jobs in the cluster
-
cooperative tasks: number of cooperative tasks in the cluster. See http://docs.hazelcast.org/docs/jet/latest-dev/manual/#cooperative-multithreading for more detailed explanation
-
non-cooperative tasks: number of non-cooperative tasks in the cluster. See http://docs.hazelcast.org/docs/jet/latest-dev/manual/#non-cooperative-processor for more detailed explanation
-
heap usage: cluster wide heap memory usage
-
cpu&memory chart: cluster wide cpu load average and total heap memory usage.
-
- Running Jobs
-
Shows the list of actively running jobs in the cluster.
-
total records in: total number of records read from the sources of the jobs
-
total records out: total number of records written to the sinks of the jobs
-
name: name/id of the job
-
start time: start time of the job.
-
up time: how long the job is running.
-
records in: number of records read from the source of this job
-
records out: number of records written to the sink of this job
-
- Completed Jobs
-
Shows an expandable/collapsable of list of completed jobs in the cluster with the following information;
-
name: name/id of the job
-
completion time: when the job is completed
-
duration: how long the job is run.
-
- Failed Jobs
-
Shows an list of failed jobs in the cluster with the following information;
-
name: name/id of the job
-
time: time of the failure
-
description: reason of the failure or the exception.
-
3.4. Cluster Overview
Cluster Overview screen provides an overview state of the Hazelcast Jet cluster and its members with the ability to shut down the cluster.
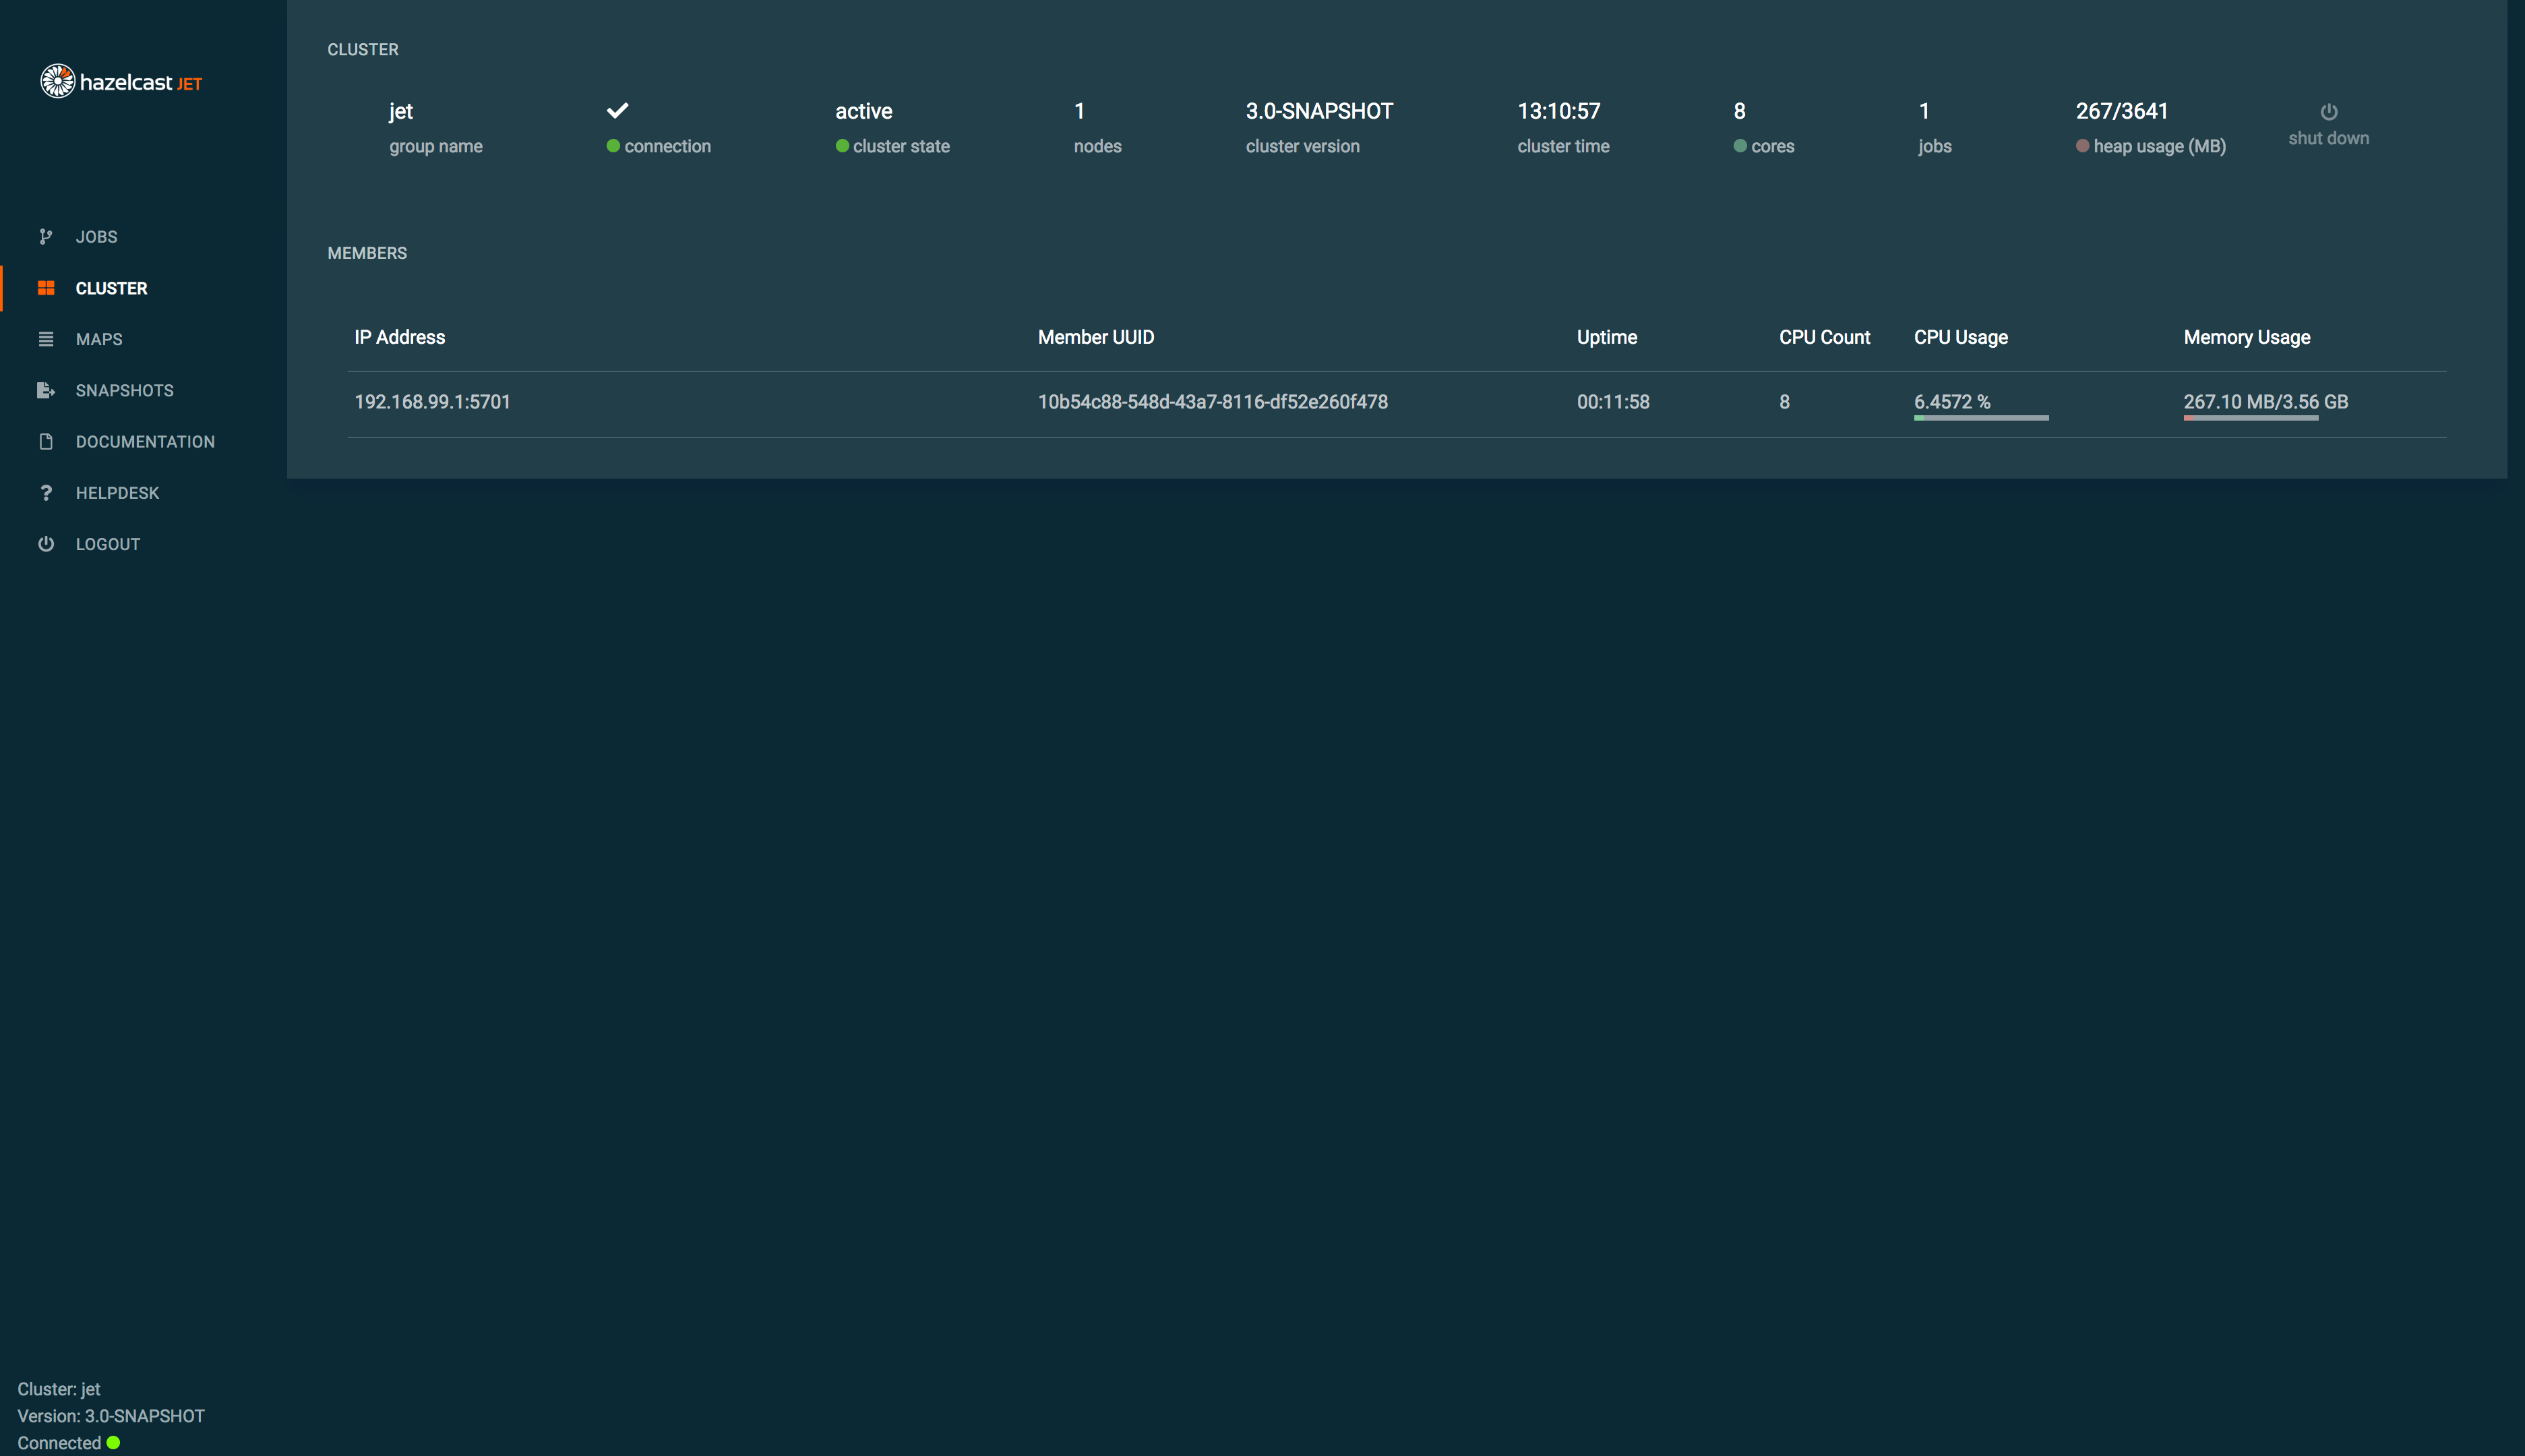
The metrics you can observe on the Cluster section are listed below;
-
group name: group name for the cluster which is used to identify cluster when joining
-
connection status: indicates the connection status between cluster and the management center
-
cluster state: current state of the cluster
-
cluster version: version of the cluster
-
cluster time: cluster-wide time
-
cores: number of available cpu cores in the cluster reported by the JVM
-
jobs: number of jobs in the cluster
-
heap usage: cluster wide heap memory usage
-
shut down: the button allows you to shut down the cluster.
The metrics you can observe on the Members section are listed below;
-
ip address: ip address of the cluster member
-
member uuid: unique member identifier within the cluster
-
cpu usage: cpu load percentage reported by the JVM
-
memory usage: used and available heap memory information
You can click on any of the cluster members and see a detailed view of them.
3.5. Snapshots
Snapshots screen provides an overview of the exported snapshots of the Hazelcast Jet jobs. To create a new export, please refer to the Job Management section.
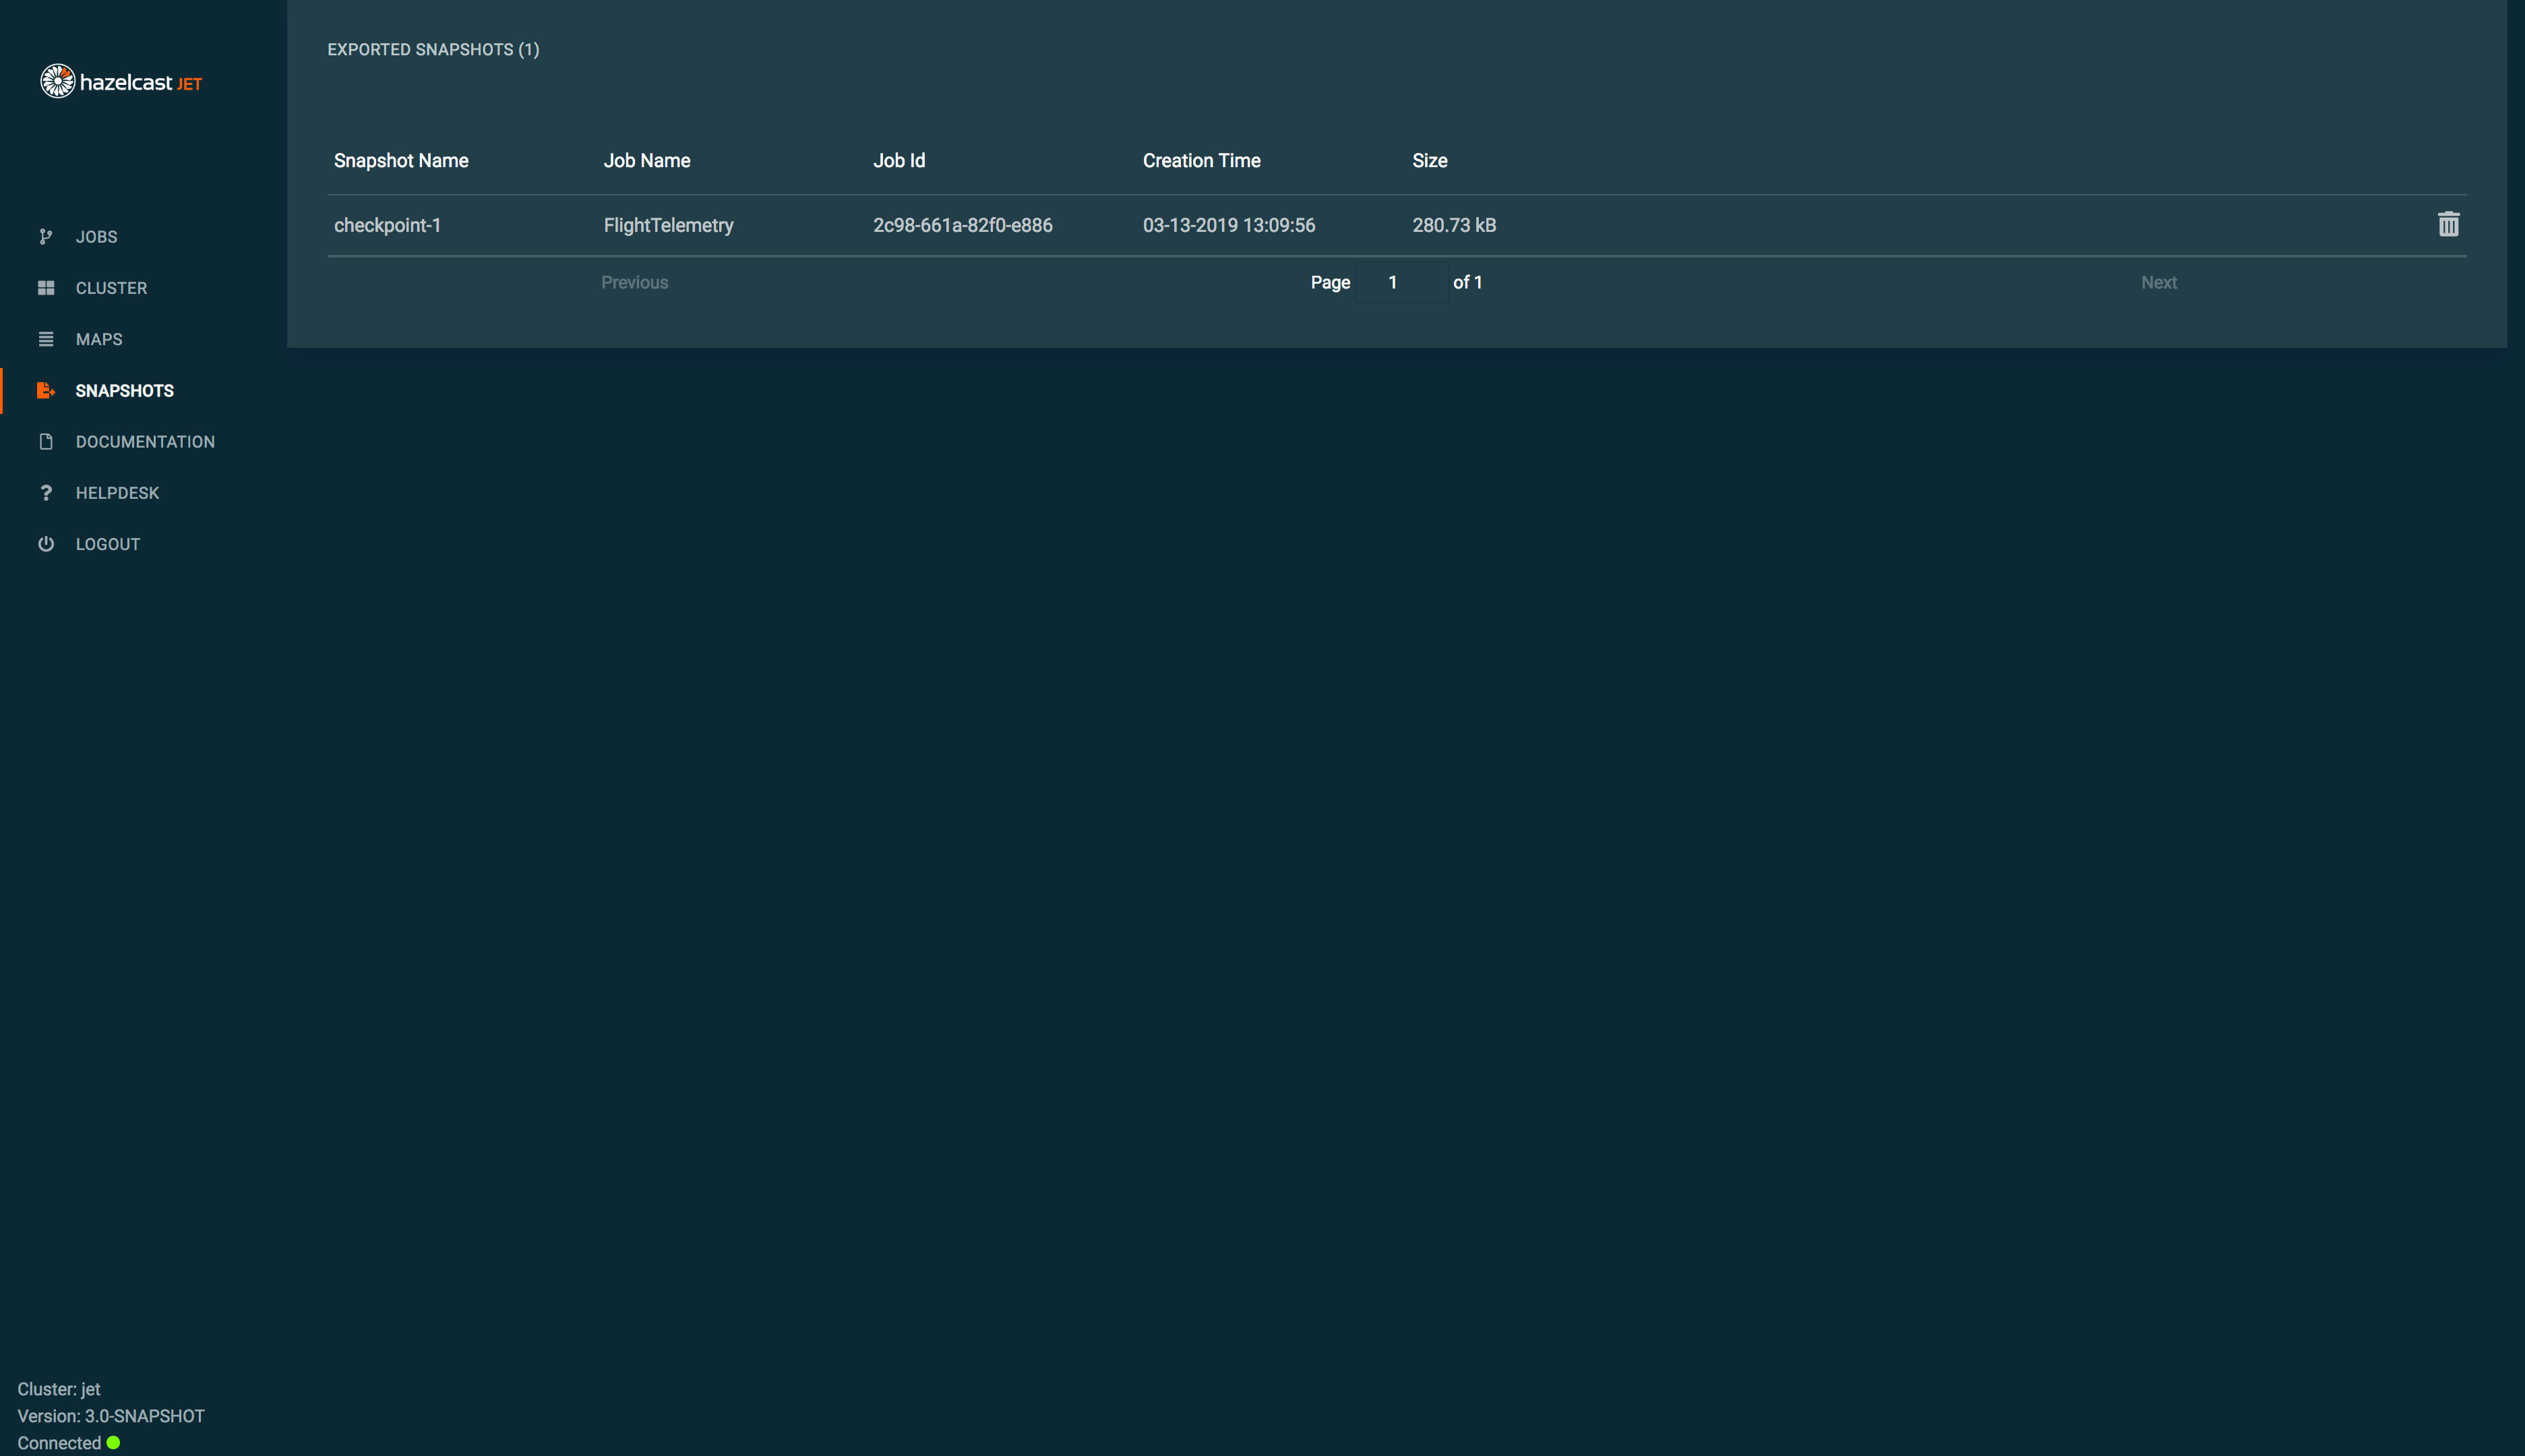
The metrics you can observe on this screen are listed below;
-
snapshot name: given name of the exported snapshot
-
job name: name of the job
-
job id: id of the job
-
creation time: creation time of the export.
-
size: size of the exported snapshot.
You can click on the trash icon to delete any exported snapshots.
3.6. Maps
Maps screen provides an overview of the maps in the Hazelcast Jet cluster.
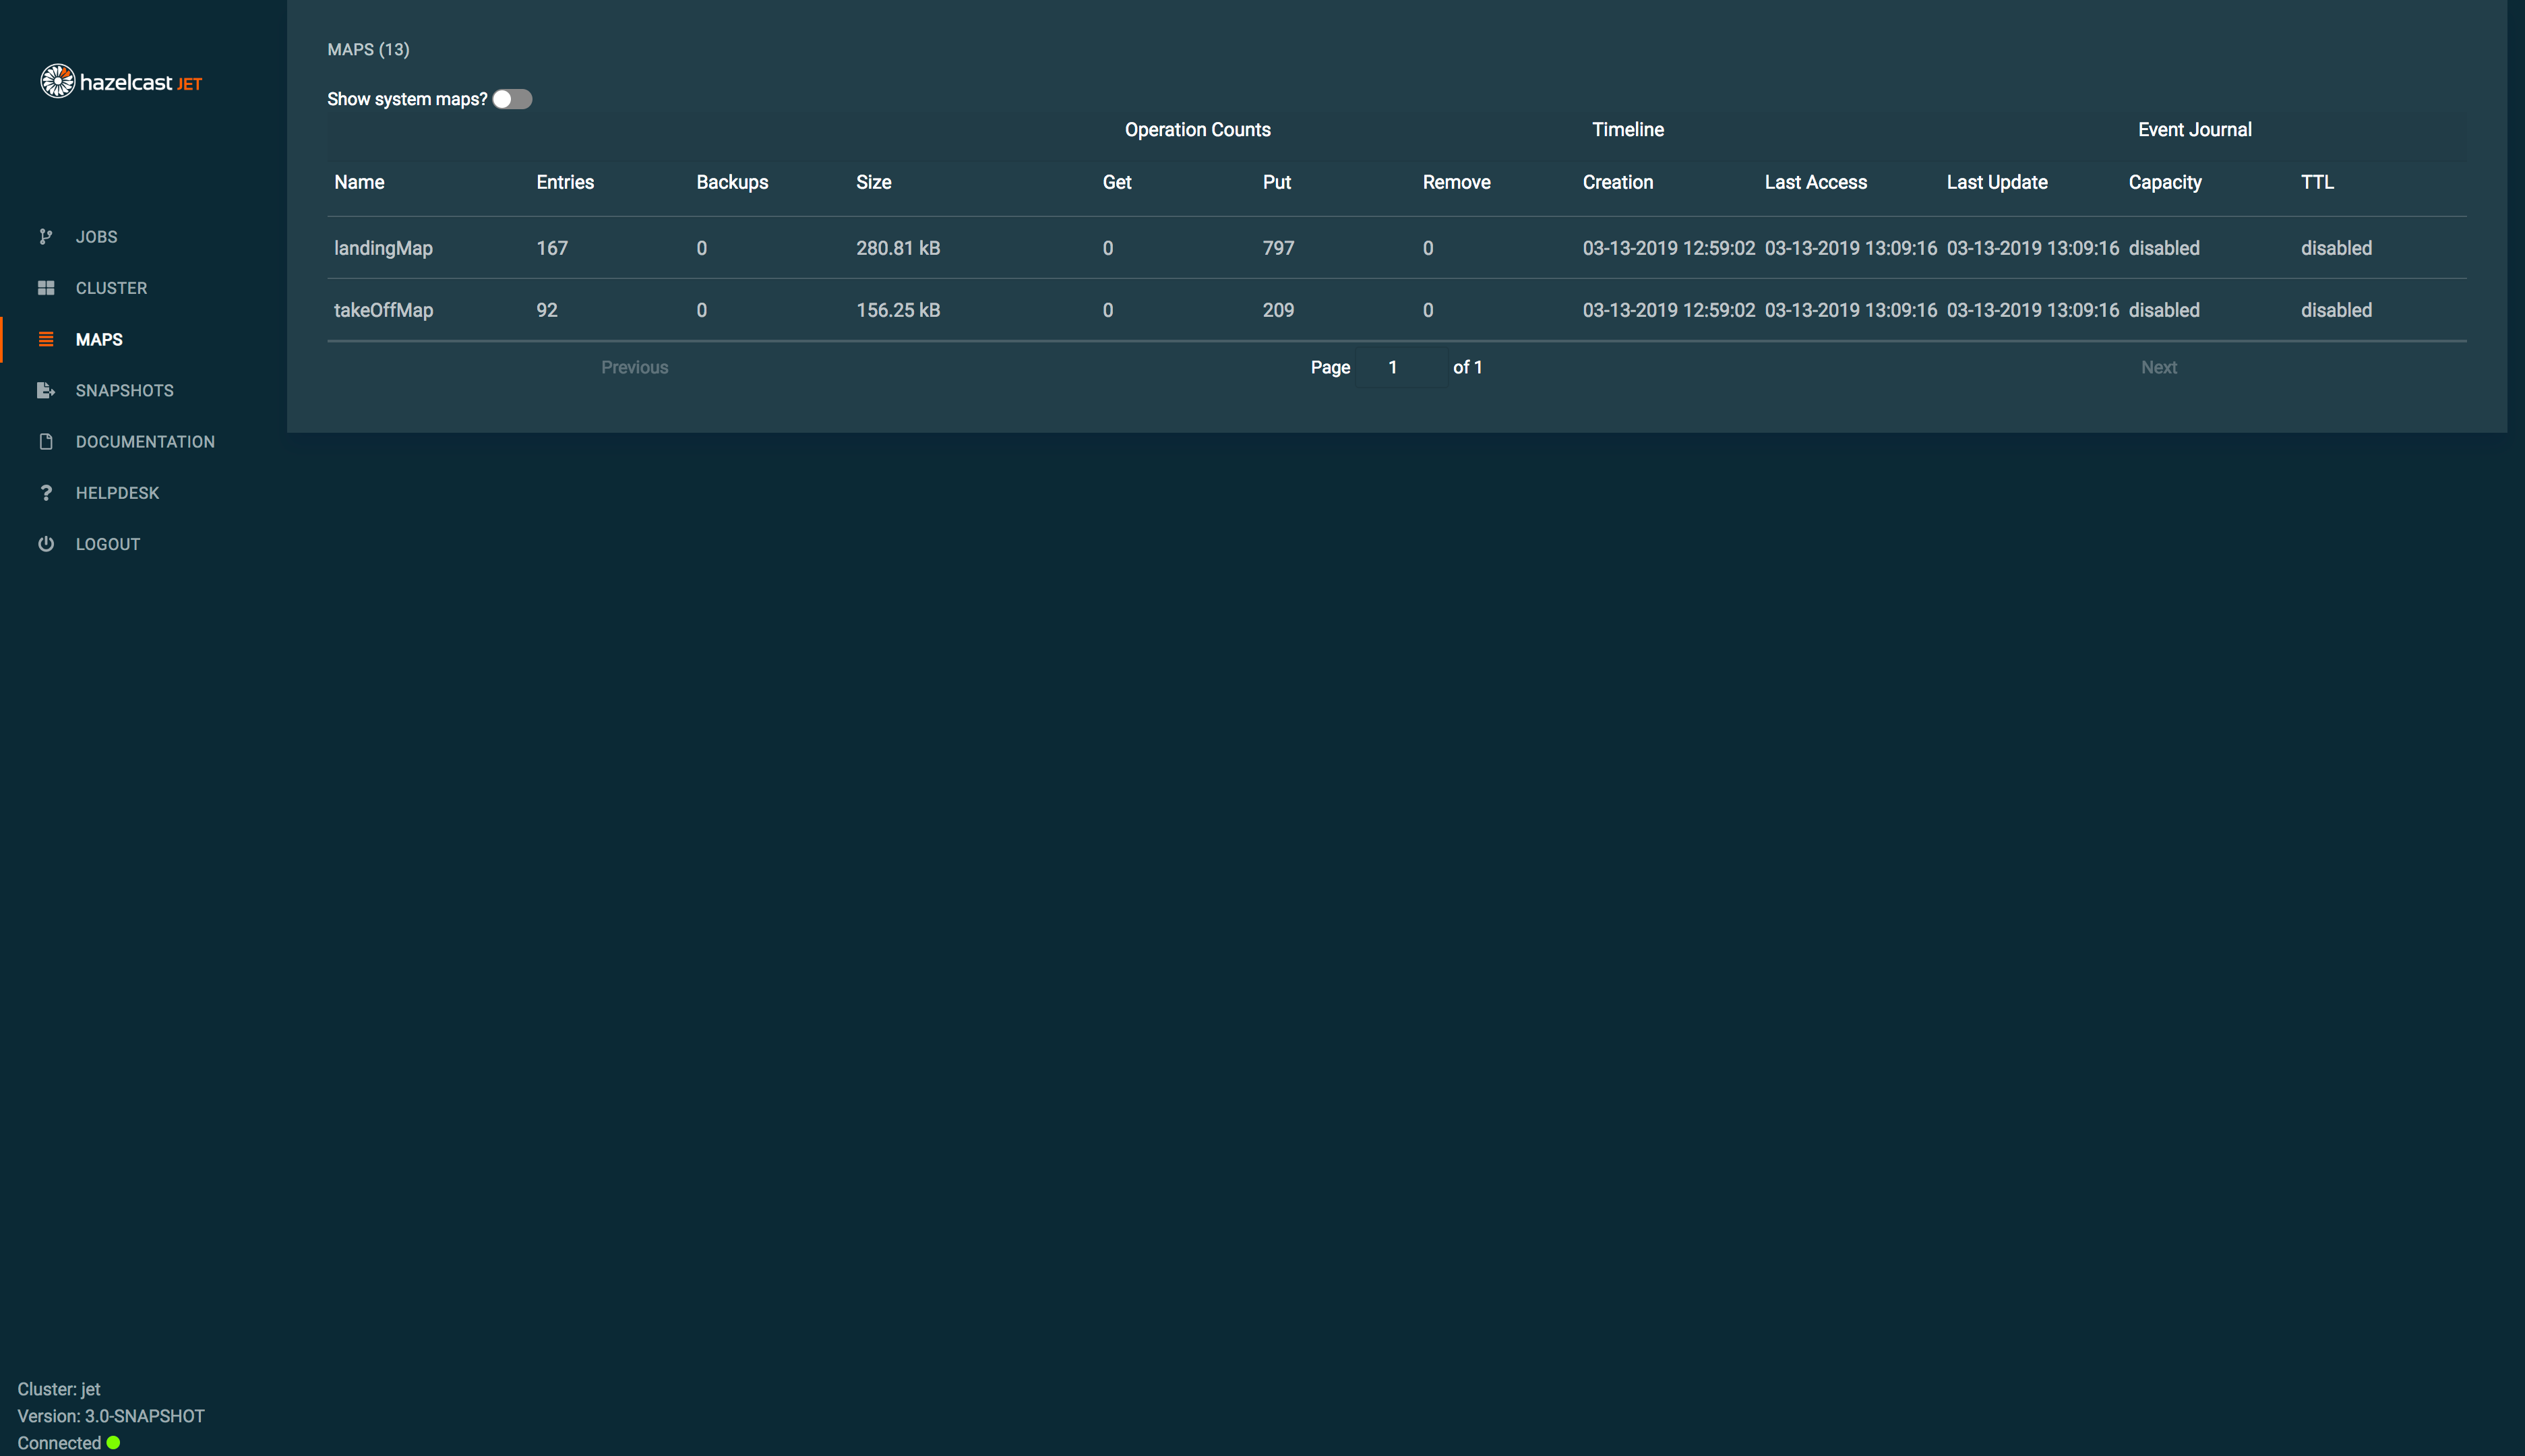
The metrics you can observe on this screen are listed below;
-
map name: given name of the exported snapshot
-
entries: number of entries in the map
-
backups: number of backup entries in the map
-
size: size of the map.
-
get: number of get operations on the map.
-
put: number of put operations on the map.
-
remove: number of remove operations on the map.
-
creation: creation time of the map.
-
last access: last access time of the map.
-
last update: last update time of the map.
-
capacity: capacity of the event journal.
-
ttl: time to live period configured for the event journal.
3.7. Member Details
Member Detailed screen provides detailed and historical information about resource usages and garbage collections about the cluster members.
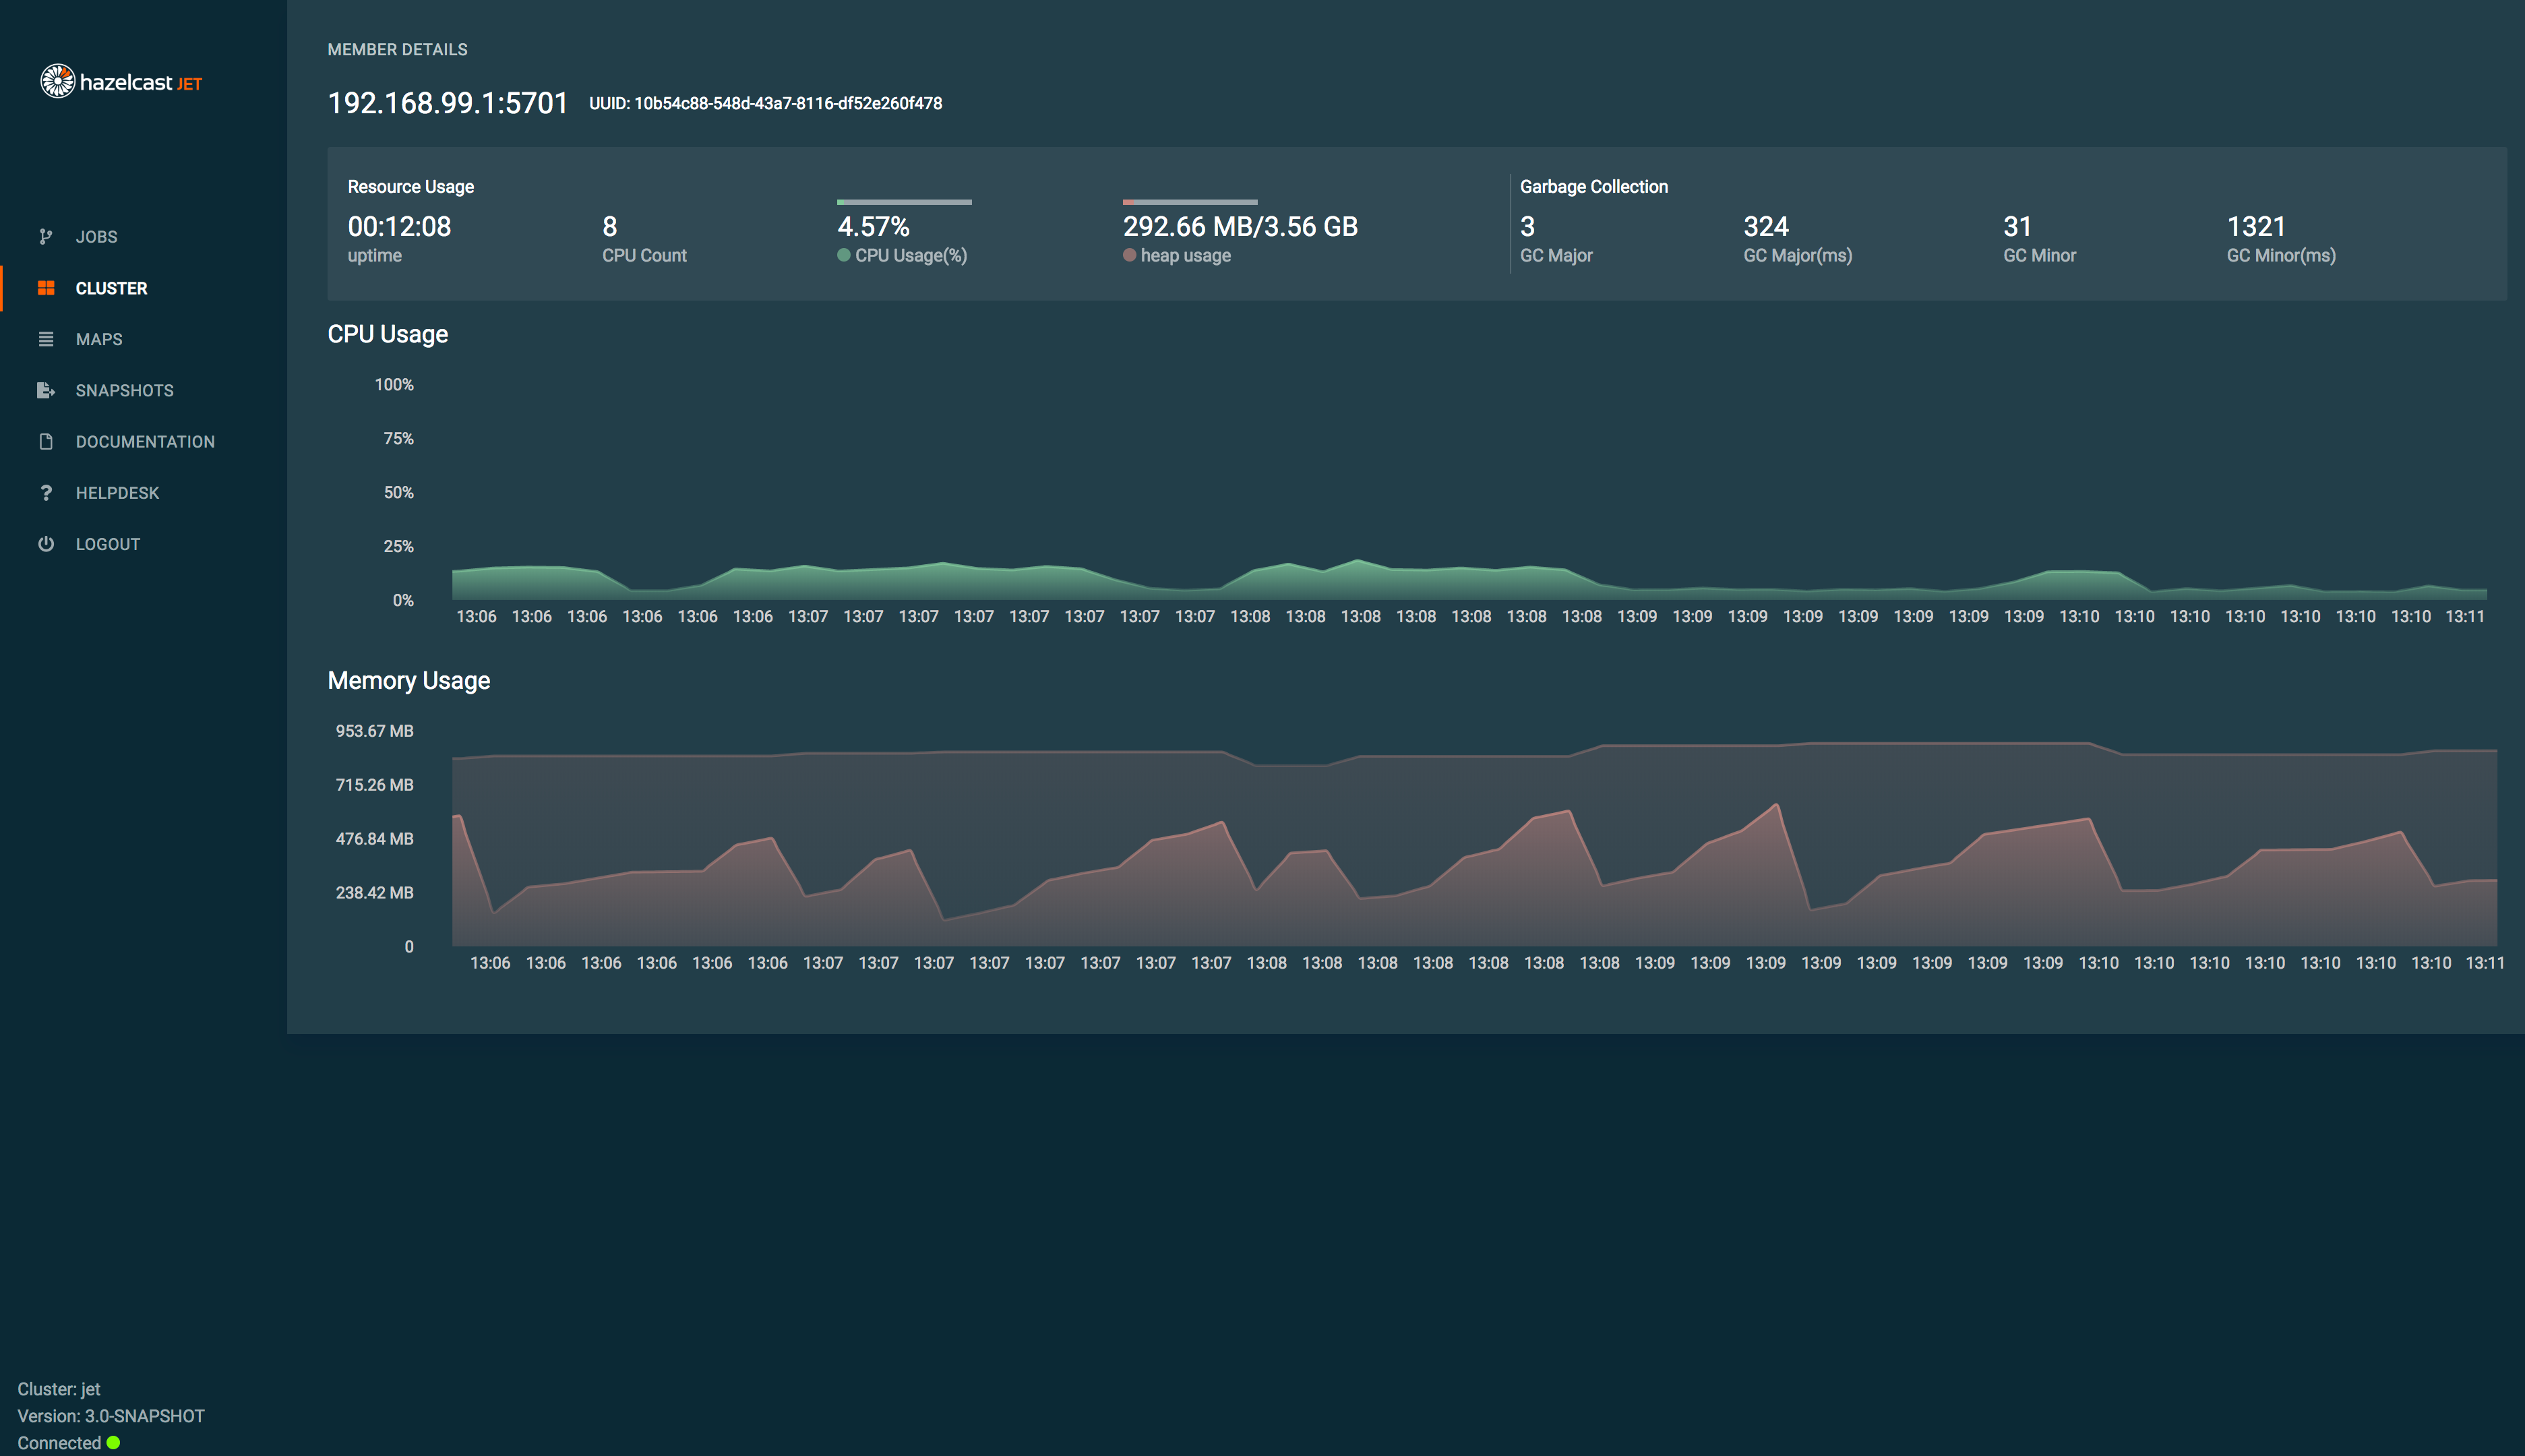
The metrics you can observe on this screen are listed below;
- Member Details
-
-
ip address: ip address of the cluster member
-
member uuid: unique member identifier within the cluster
-
- Resource Usage
-
Shows resource usage information of the member by providing following metrics;
-
uptime: number of nodes in the cluster
-
cpu count: number of available cpu cores on member reported by the JVM
-
cpu usage: cpu load percentage reported by the JVM
-
heap usage: used and available heap memory information
-
- Garbage Collection
-
Shows garbage collection information of the member by providing following metrics;
-
gc major: number of major (stop-the-world) garbage collections
-
gc major time: total duration of major (stop-the-world) garbage collections
-
gc minor: number of minor garbage collections
-
gc minor time: total duration of minor garbage collections
-
- CPU Usage
-
Shows the cpu load for the last 5 minutes.
- Memory Usage
-
Shows the used memory (the amount of memory used by the member) and total memory(the amount of memory currently available to the JVM) usage for the last 5 minutes.
3.8. Jobs
Jobs screen provides general overview of the jobs in the Hazelcast Jet cluster.
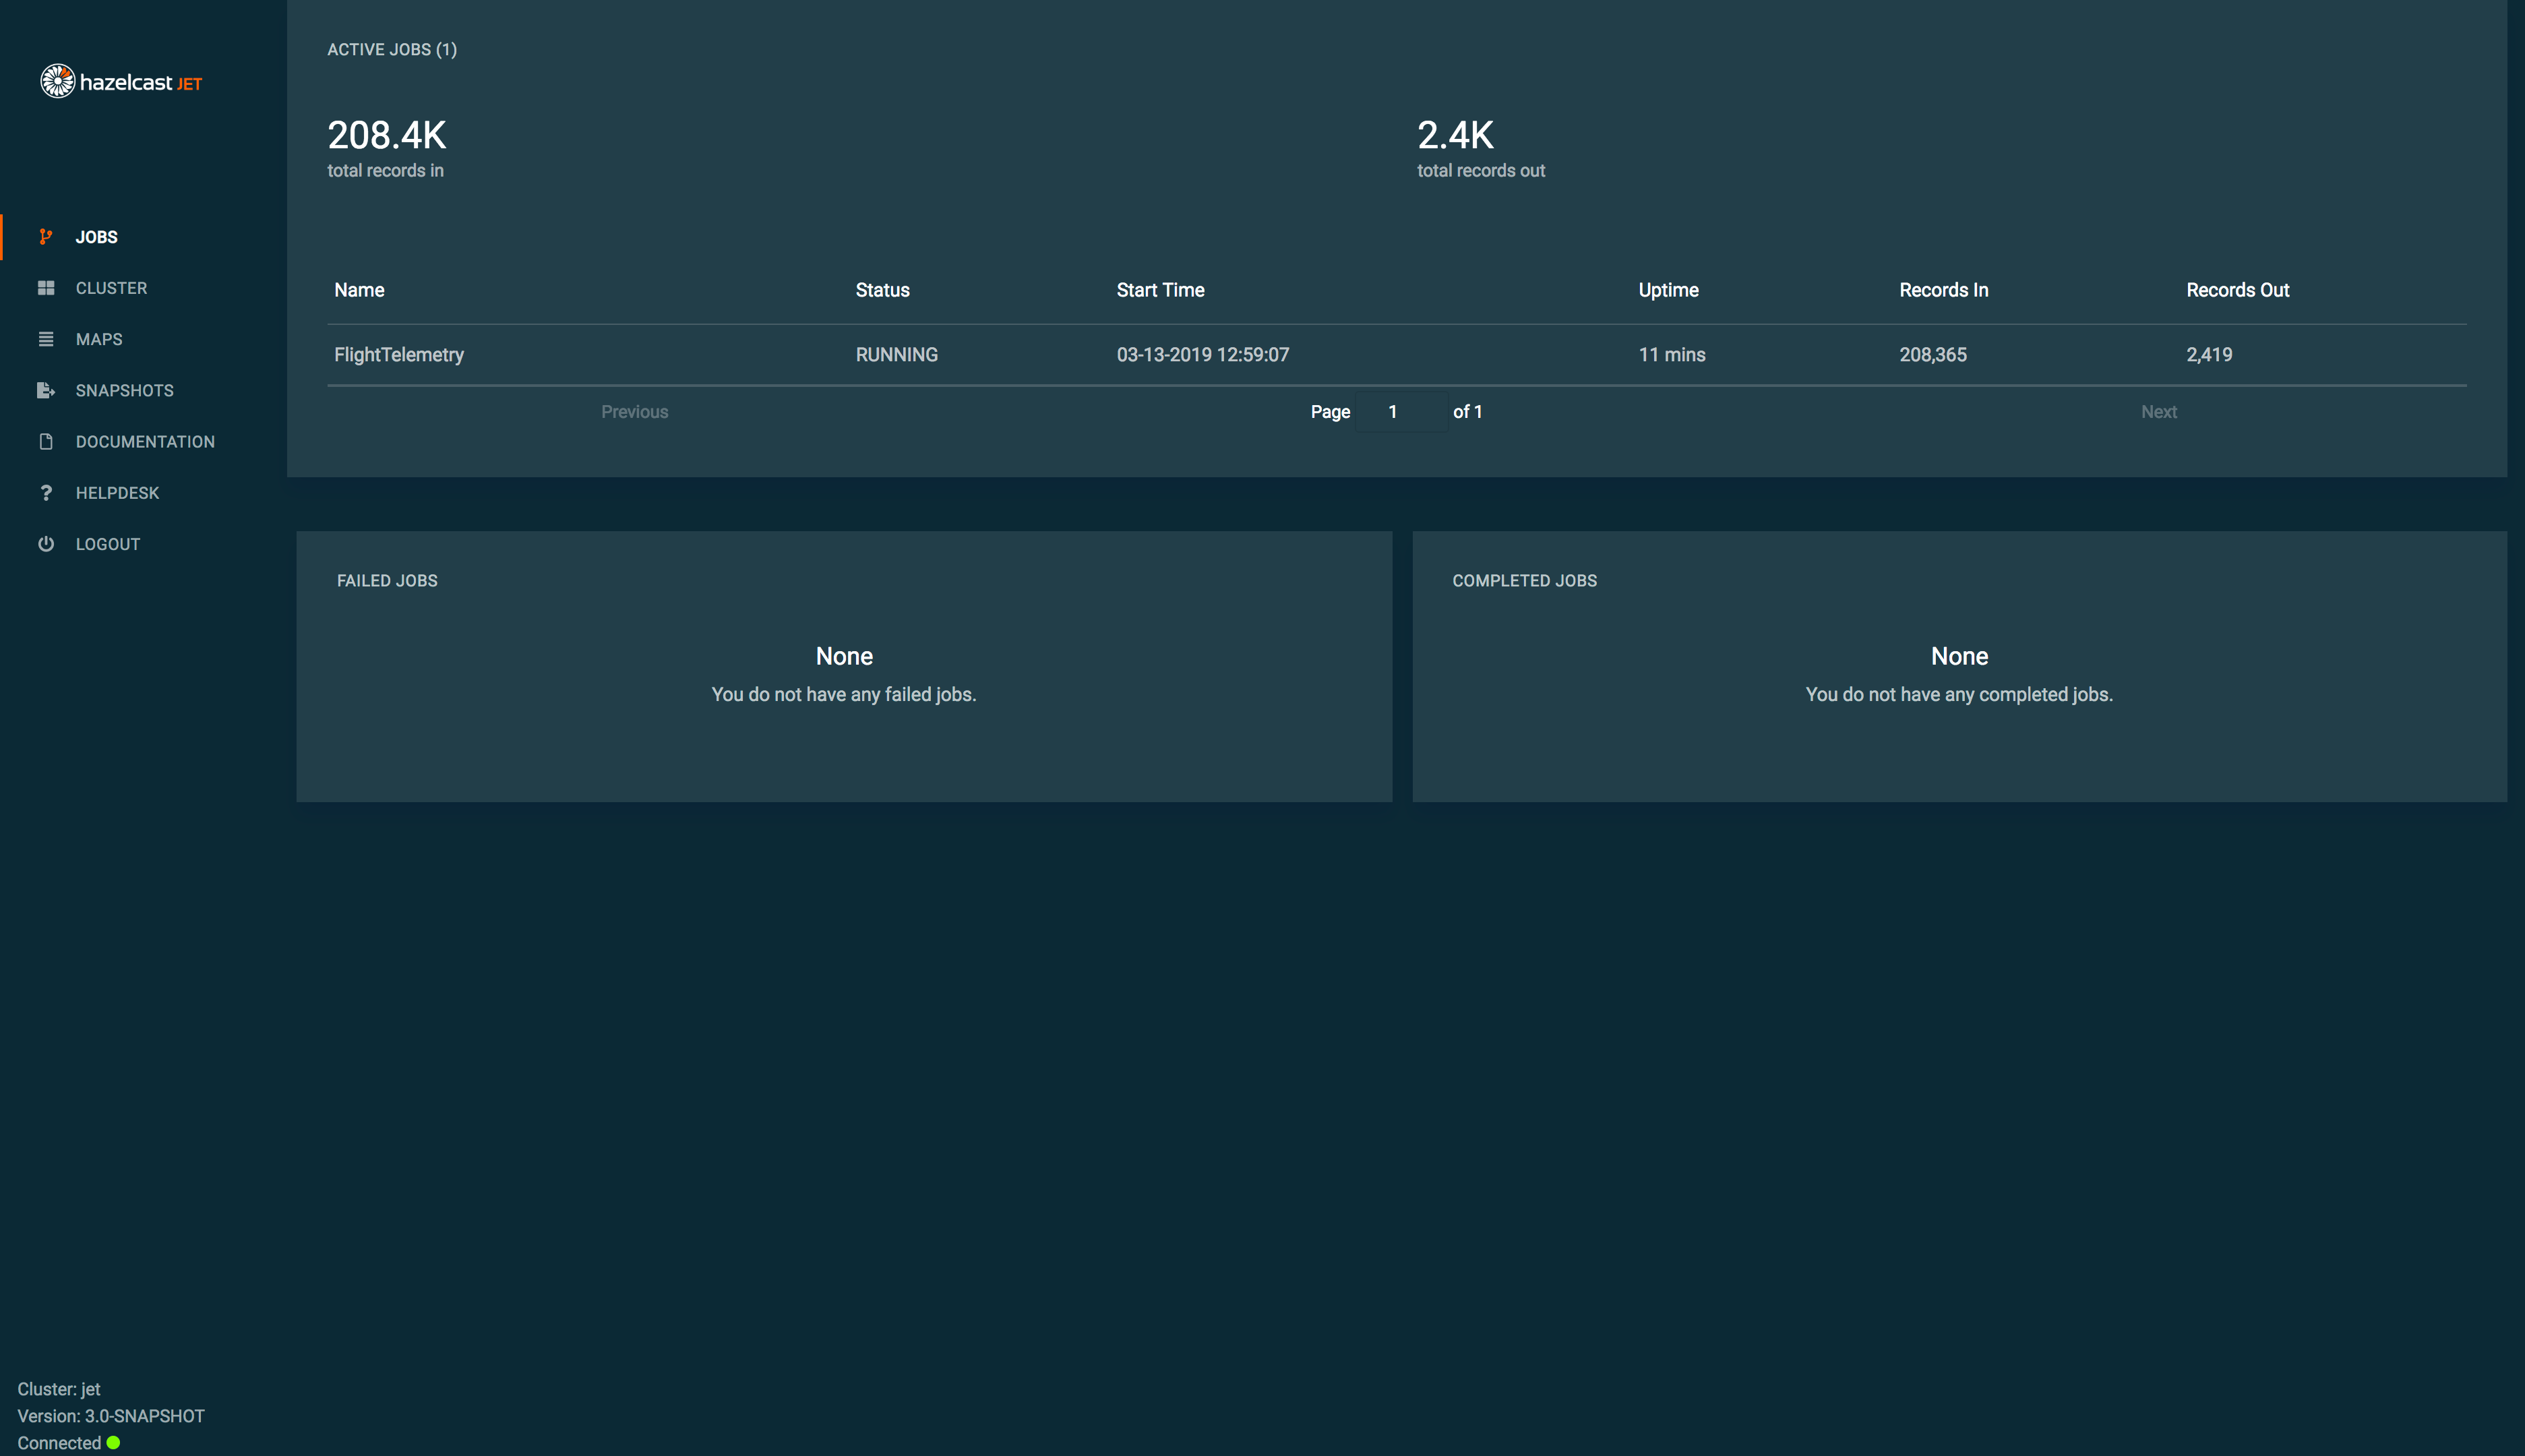
- Running Jobs
-
Shows the list of actively running jobs in the cluster.
-
total records in: total number of records read from the sources of the jobs
-
total records out: total number of records written to the sinks of the jobs
-
name: name/id of the job
-
start time: start time of the job.
-
up time: how long the job is running.
-
records in: number of records read from the source of this job
-
records out: number of records written to the sink of this job
-
- Failed Jobs
-
Shows an expandable/collapsible of list of failed jobs in the cluster with the following information;
-
name: name/id of the job
-
time: the the of the job failure
-
description: failure message or exception type.
-
- Completed Jobs
-
Shows an expandable/collapsible of list of completed jobs in the cluster with the following information;
-
name: name/id of the job
-
completion time: when the job is completed
-
duration: how long the job is run.
-
3.9. Job Details
Job detail screen is a tool for diagnosing data flow within the job. It provides graphical visualization of the stages, ability to manage lifecycle of the job and allows you to peek into dataflow stats across the DAG. One can diagnose bottlenecks this way.
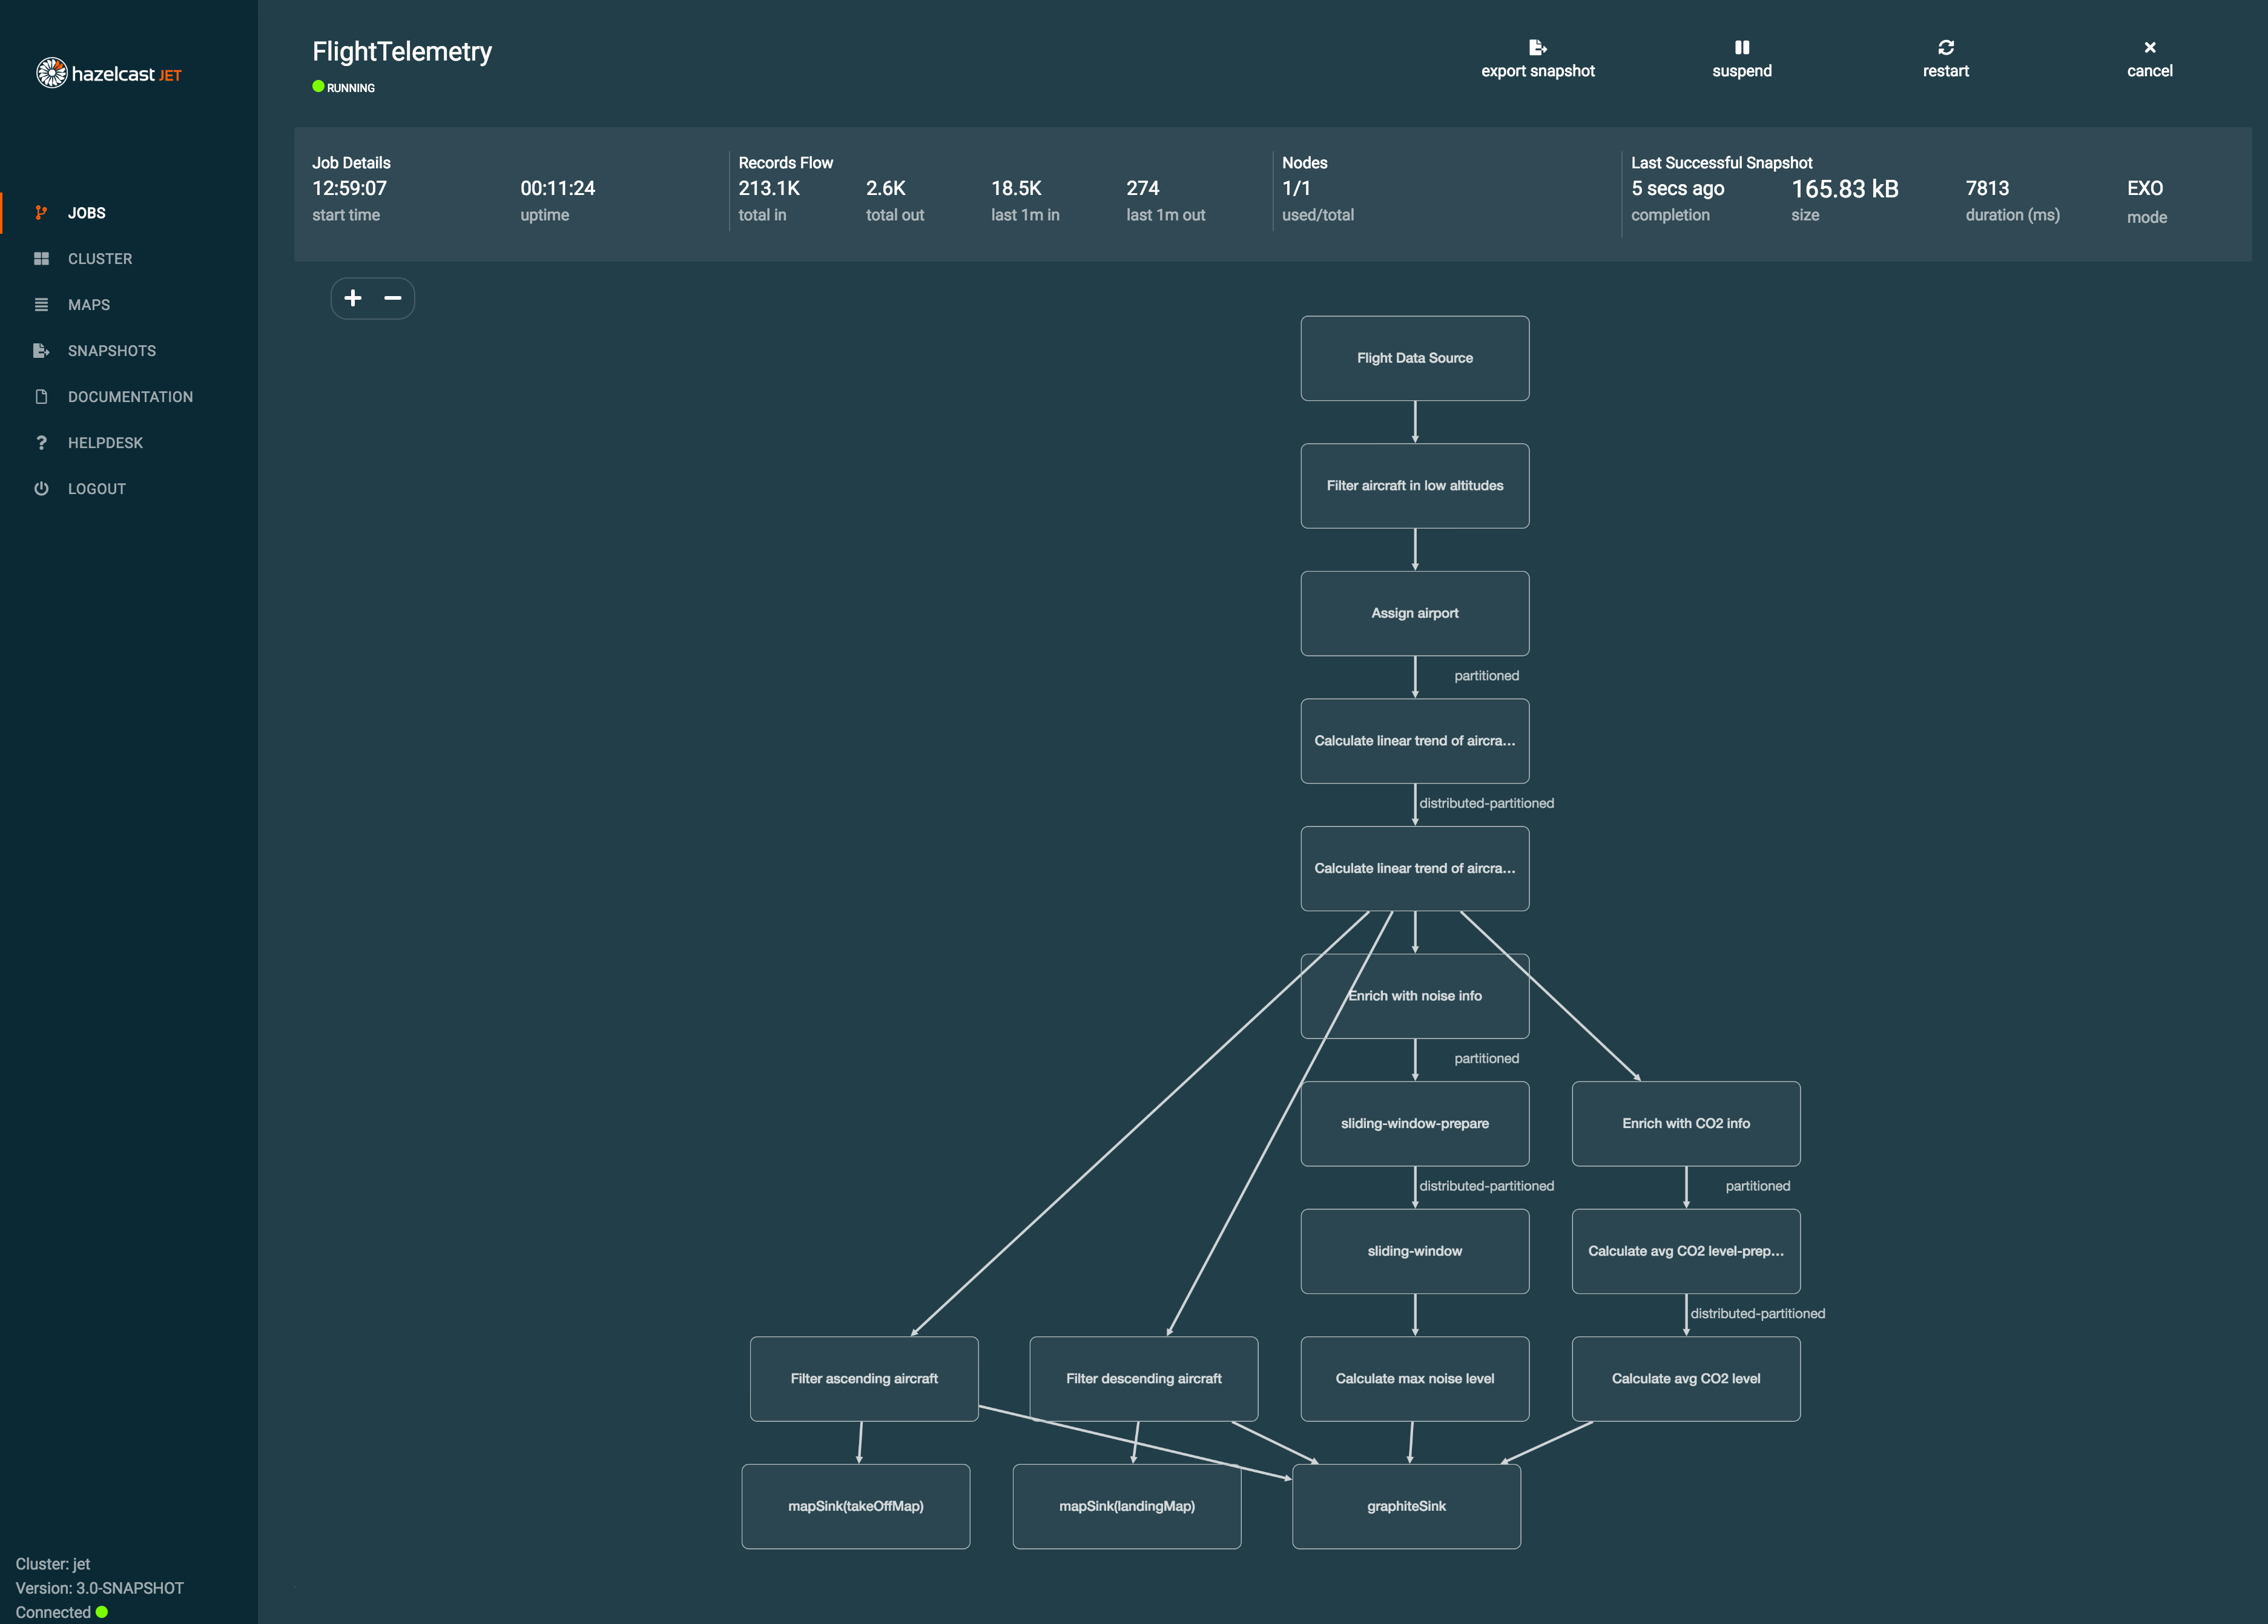
- Job Management
-

-
export snapshot: initiates a named snapshot export, exported snapshots can be managed via snapshots view.
-
suspend: suspends the running job, only visible when the job is in
RUNNINGstate -
resume: resumes the suspended job, only visible when the job is in
SUSPENDEDstate -
restart: stops the execution of the job and starts a new execution for it
-
cancel: stops the execution of the job
-
- Job Details
-

-
name: name/id of the job
-
up time: how long the job is running.
-
- Records Flow
-
 Shows the list of actively running jobs in the cluster.
-
total in: total number of records read from the source of the job
-
total out: total number of records written to the sink of the job
-
last min in: number of records read from the source of the job in the last minute
-
last min out: number of records written to the sink of the job in the last minute
-
- Nodes
-

-
name: name/id of the job
-
- Last Successful Snapshot
-

-
completion: latest successful snapshot completion time
-
size: the size of the snapshot
-
duration: how long it took to create a snapshot
-
mode: processing guarantee mode of the job, either
None,At Least OnceorExactly Once
-
- Job Visualization
-
Graphical representation of the job topology.
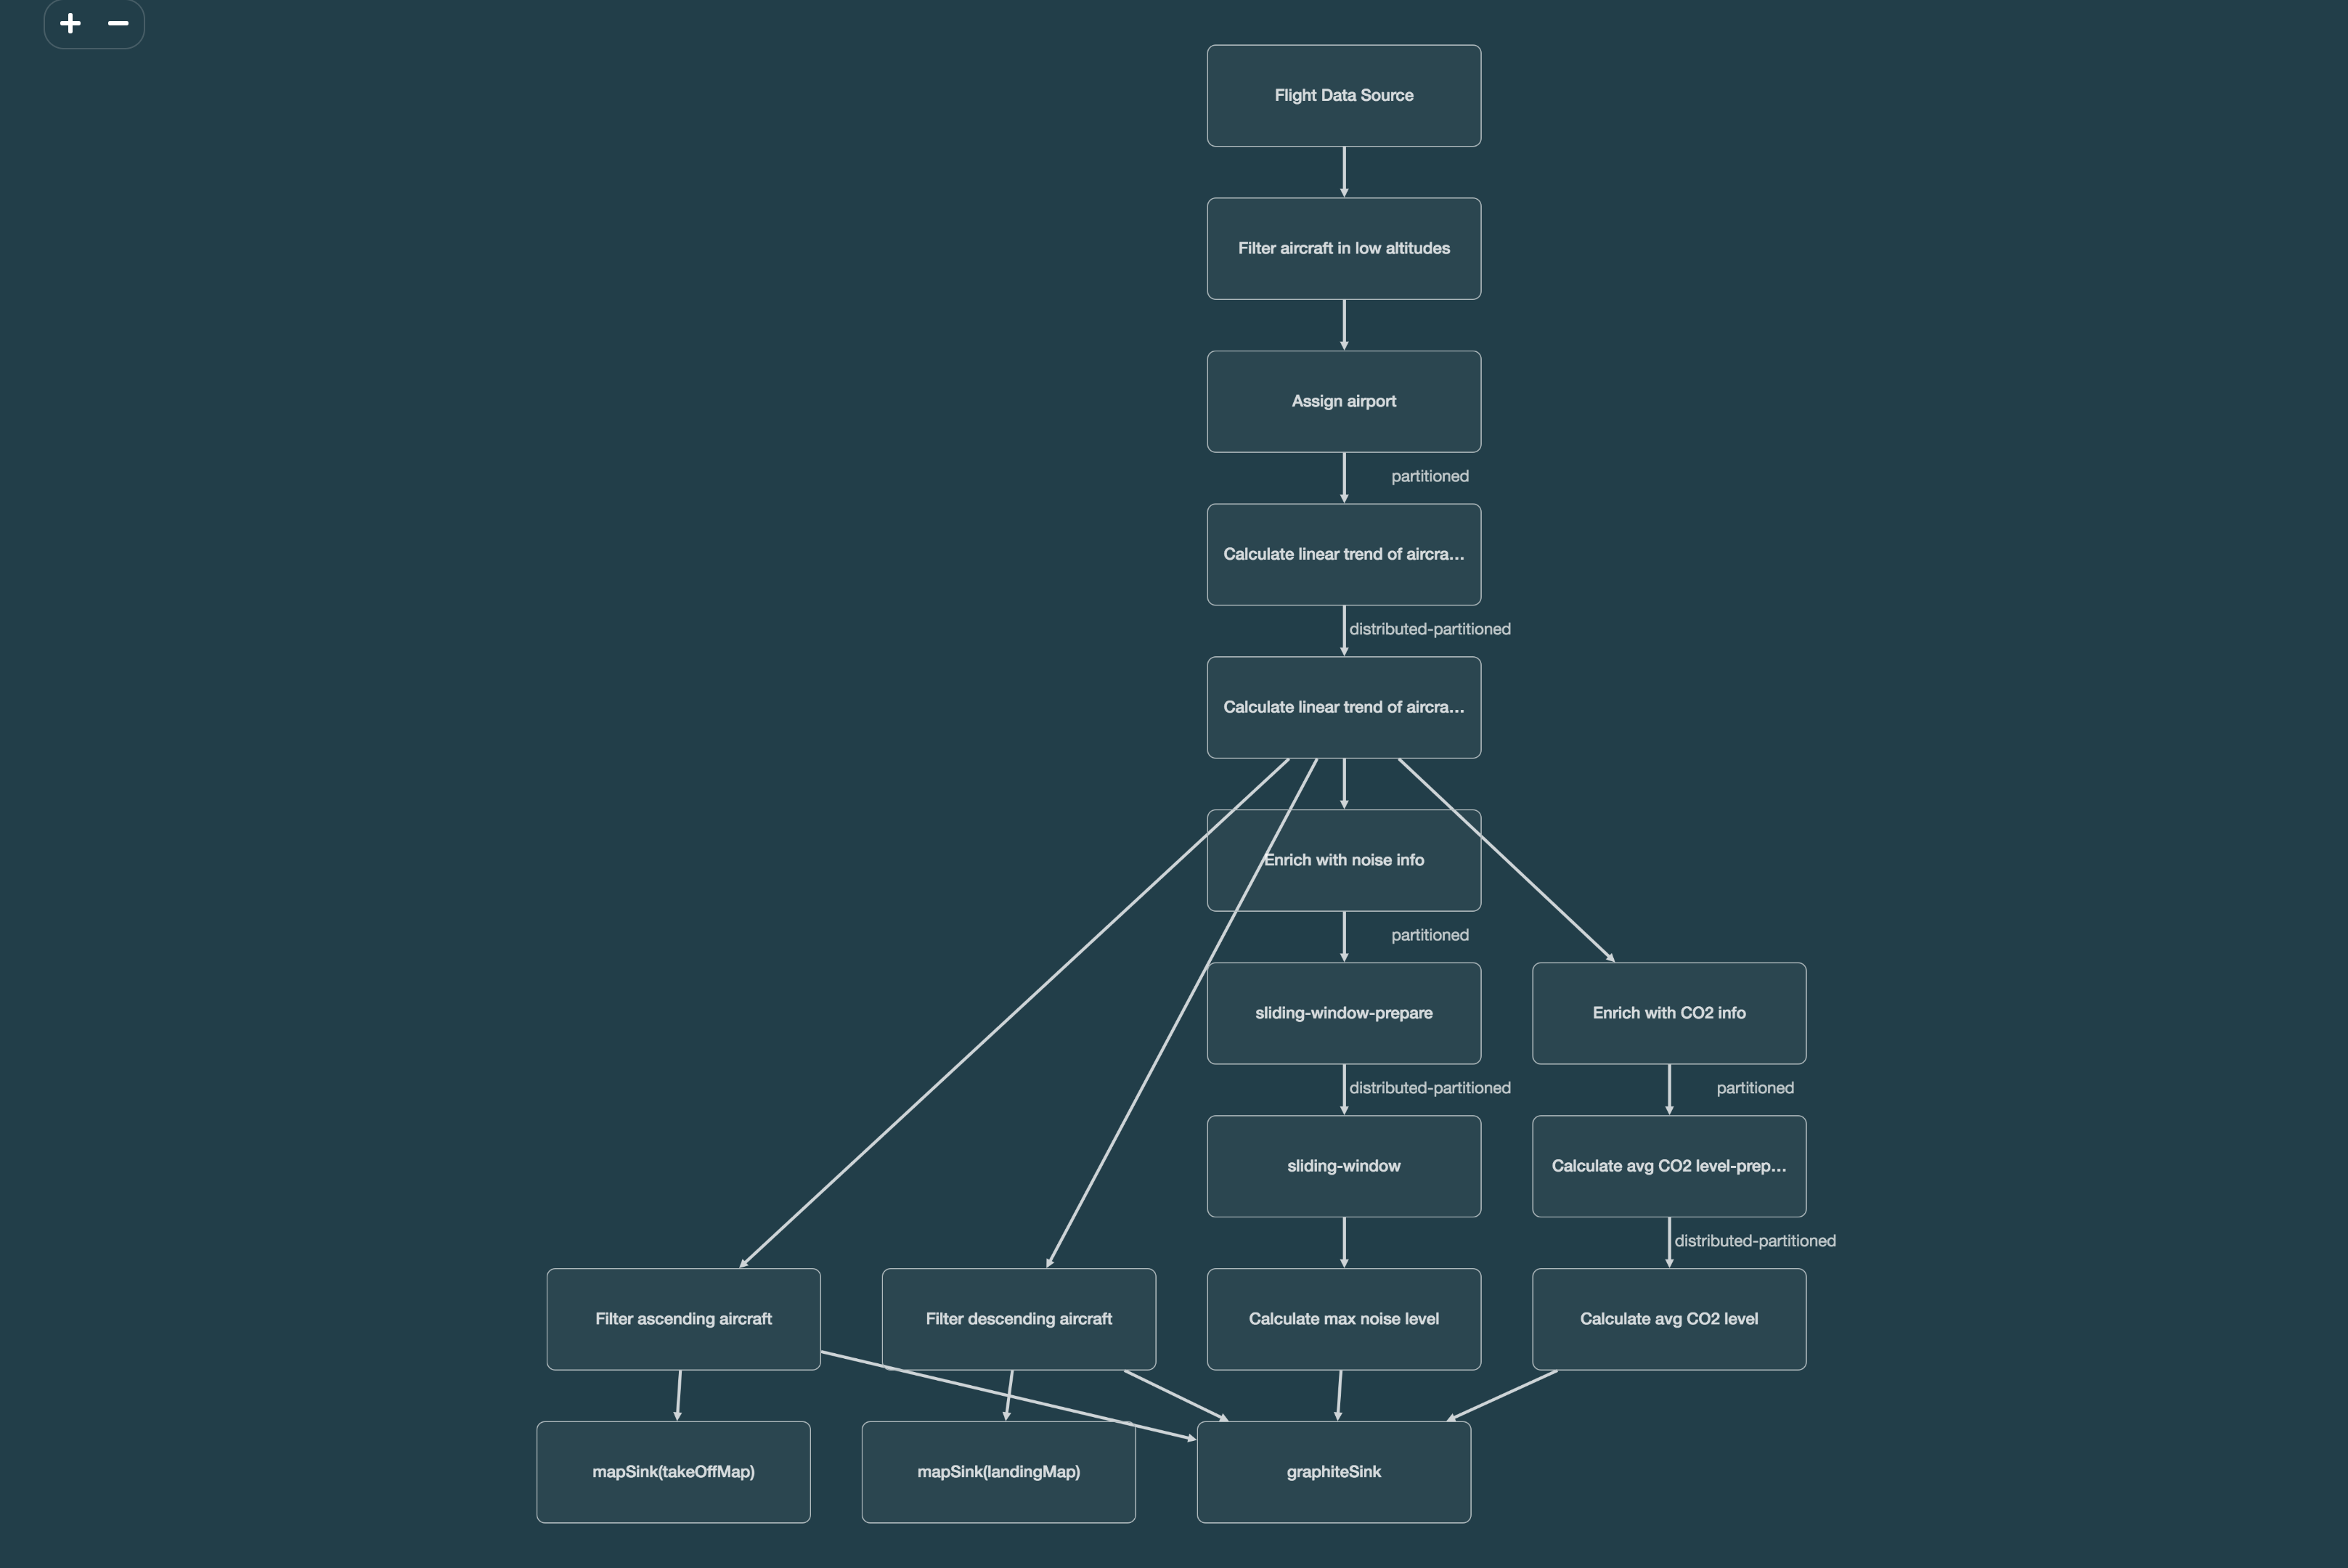
- Vertex Details
-
Shows information about the selected vertex on the Job Visualization section.
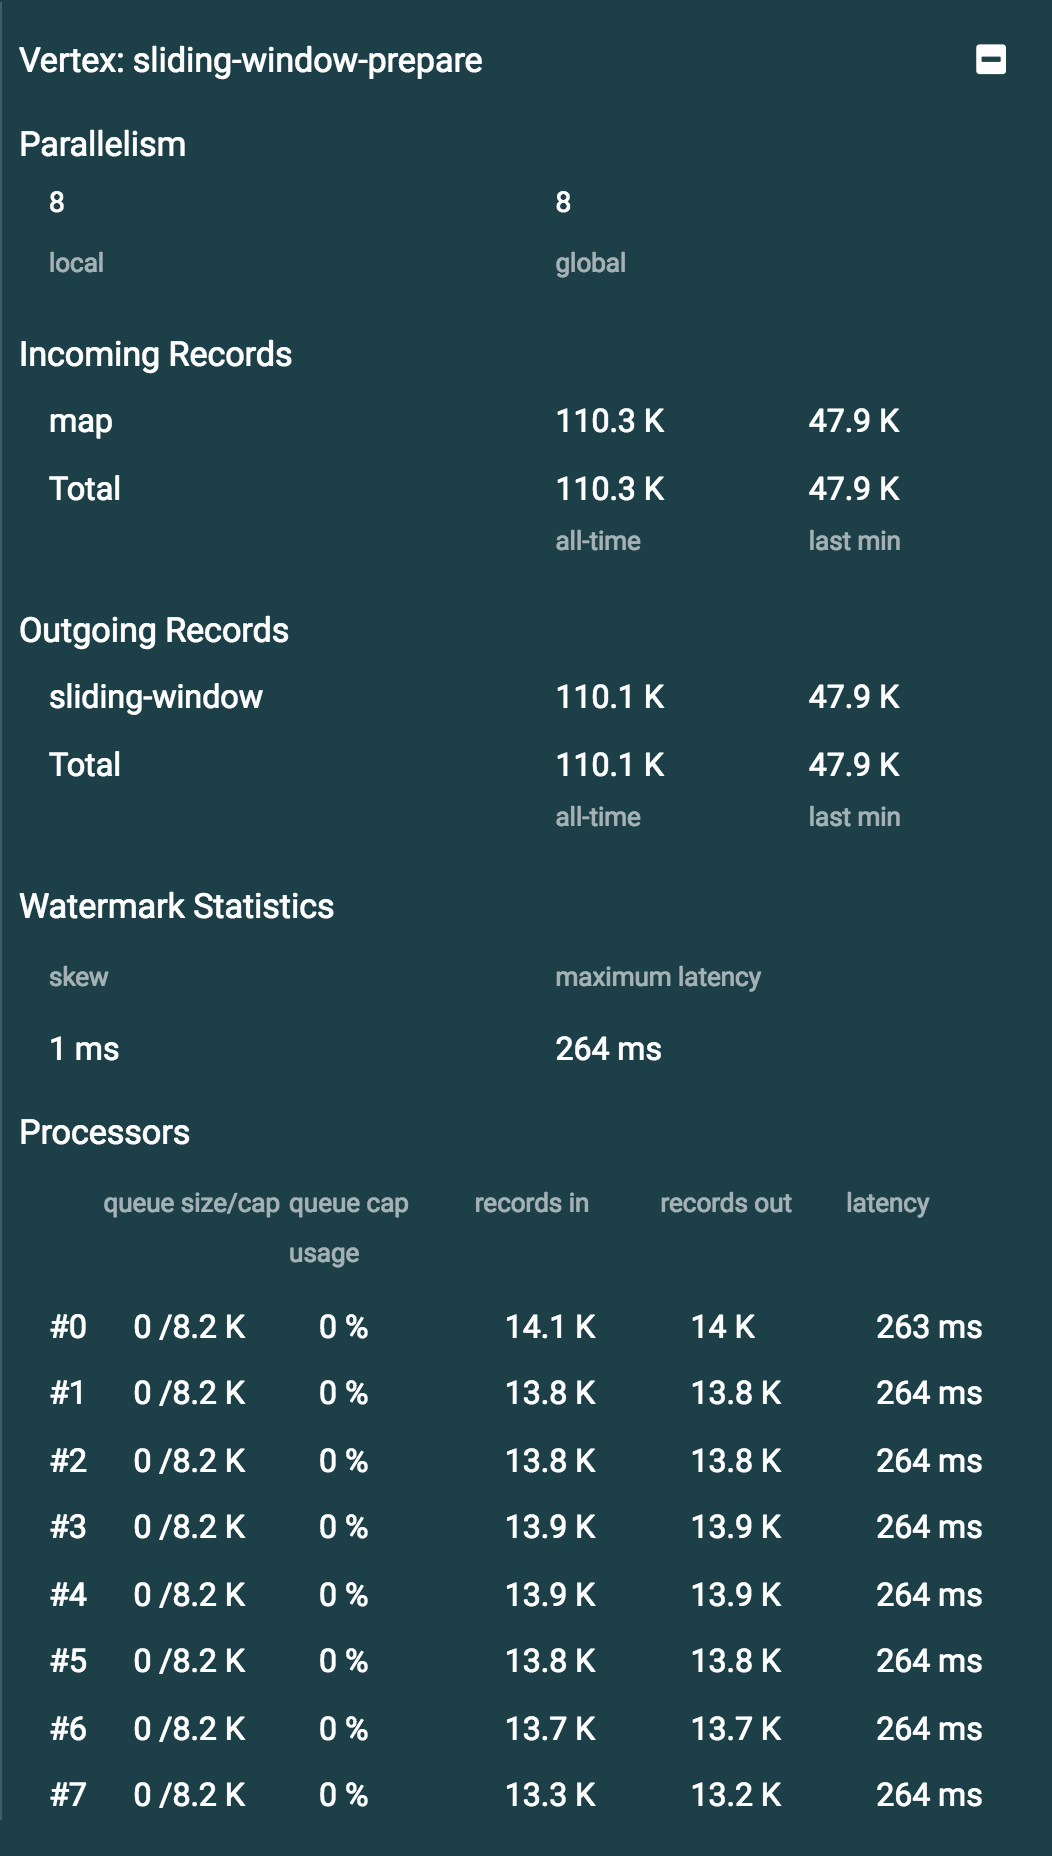
- Parallelism
-
-
local: number of processors running for that vertex on each member
-
global: total number of processors running for that vertex on cluster.
-
- Incoming Records
-
Lists all of the incoming edges by their source vertices and shows the following metrics and totals for each of them.
-
all-time: total number of records received by this vertex
-
last min: number of records received by this vertex in the last minute
-
- Outgoing Records
-
Lists all of the outgoing edges by their target vertices and shows the following metrics and totals for each of them.
-
all-time: total number of records sent by this vertex
-
last min: number of records sent by this vertex in the last minute
-
- Watermarks
-
-
skew: skew is the difference between latencies of the processor with the highest and lowest latency. Most common cause is a long event-to-event interval in some source partition or an idle partition (until the idle timeout elapses). Overload of events in one partition can also cause it.
-
latency: latency is the time difference between wall-clock time and the last forwarded watermark (“event time, time of the stream”). Multiple factors contribute to the total latency, such as the latency in the external system, allowed lag (which is always included), clock drift and, and also long event-to-event intervals in any partition (this one is the trickiest). See latency section for more information.
-
- Processors
-
Lists all of the processors this vertex has in the cluster and shows the following metrics for each of them.
-
queue size: current size of the processor inbox queue
-
queue cap: capacity of the processor inbox queue
-
queue cap usage: queue utilization percentage
-
records in: total number of records received by this processor
-
records out: total number of records sent by this processor
-
latency: latency is the time difference between wall-clock time and the last forwarded watermark (“event time, time of the stream”). Multiple factors contribute to the total latency:
-
latency in the external system: that is, events arrive already delayed to Jet source
-
allowed lag: if you allow for some time to wait for delayed events, watermarks will always be delayed by this lag. Note that the actual output might not be delayed.
-
event-to-event interval: if there is a time period between two events, the event time “stops” for that time. In other words, until a new event comes, Jet thinks the current time is the time of the last event. As “current event time” is tracked independently for each partition, this can be the major source of skew. If your events are irregular, you might consider adding heartbeat events. This factor also applies if you use
withIngestionTimestampssince a new wall-clock time is assigned only if new event arrives. -
time to execute map/filter stages: they contribute with the latency of the async call or with the time to execute cpu-heavy sync call.
-
internal processing latency of Jet: this is typically very low, 1-2ms. Can be higher if the network is slow, system is overloaded, if there are many vertices in the job or many jobs, which causes lot of switching etc.
-
clock drift: since we’re comparing to the real time, latency can be caused by a clock drift between the machine where event time is assigned (which can be also be an end user’s device). It can even be negative. Always use NTP to keep wall clock precise and avoid using timestamps from devices out of your control as event time.
-
-
- Edge Details
-
Shows information about the selected edge on the Job Visualization section.
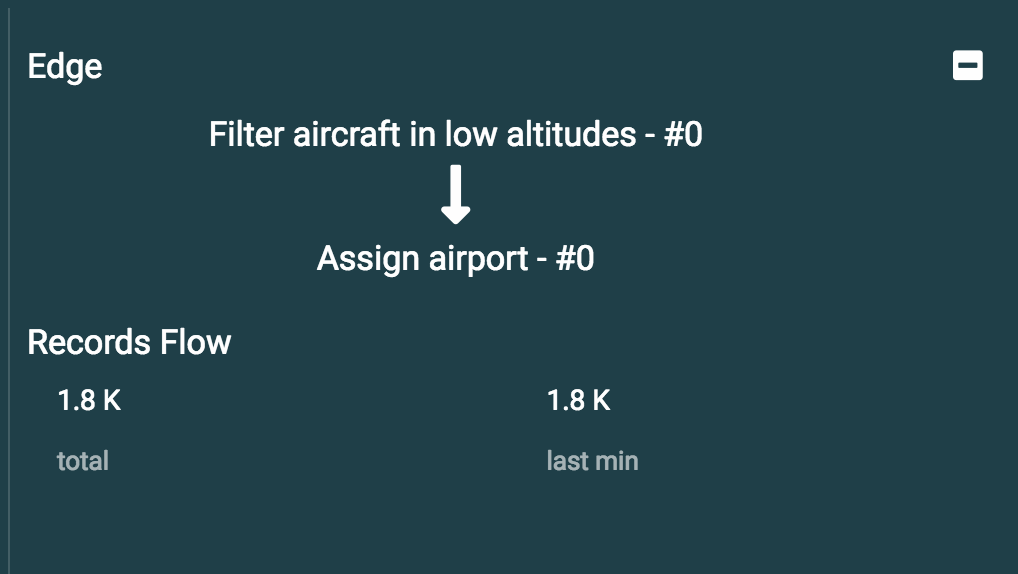
- Records Flow
-
-
total: total number of records passed through this edge
-
last min: number of records passed through this edge in the last minute
-