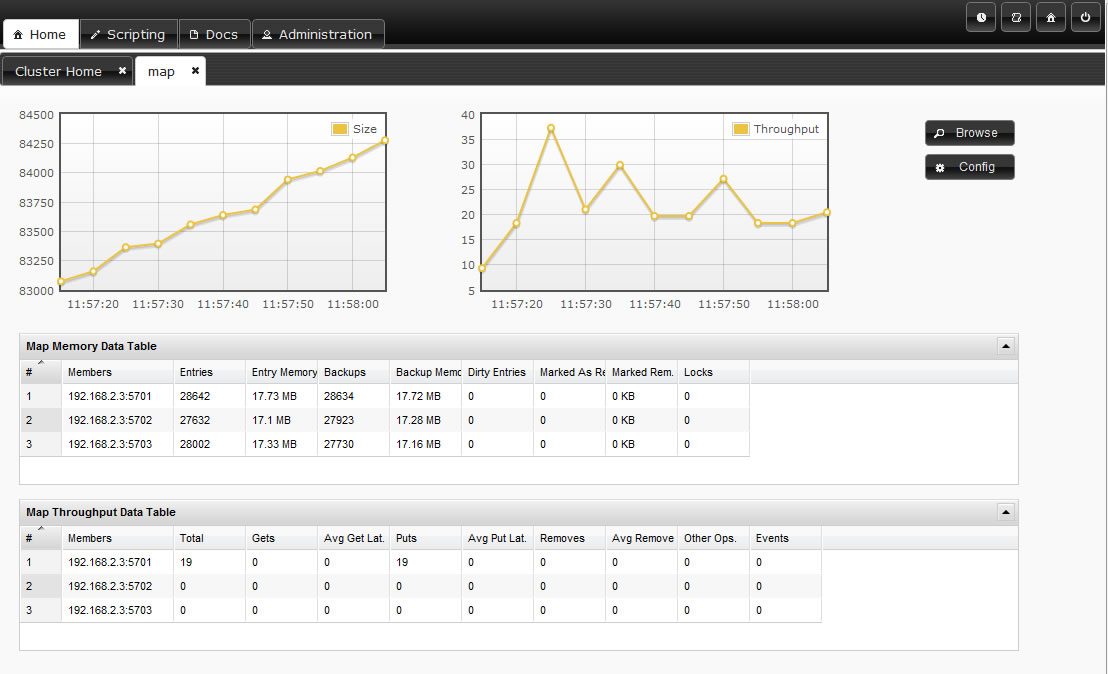
Map instances are listed on the left panel. When you click on a map, a new tab for monitoring this map instance is opened on the right. In this tab, you can monitor metrics also re-configure the map.

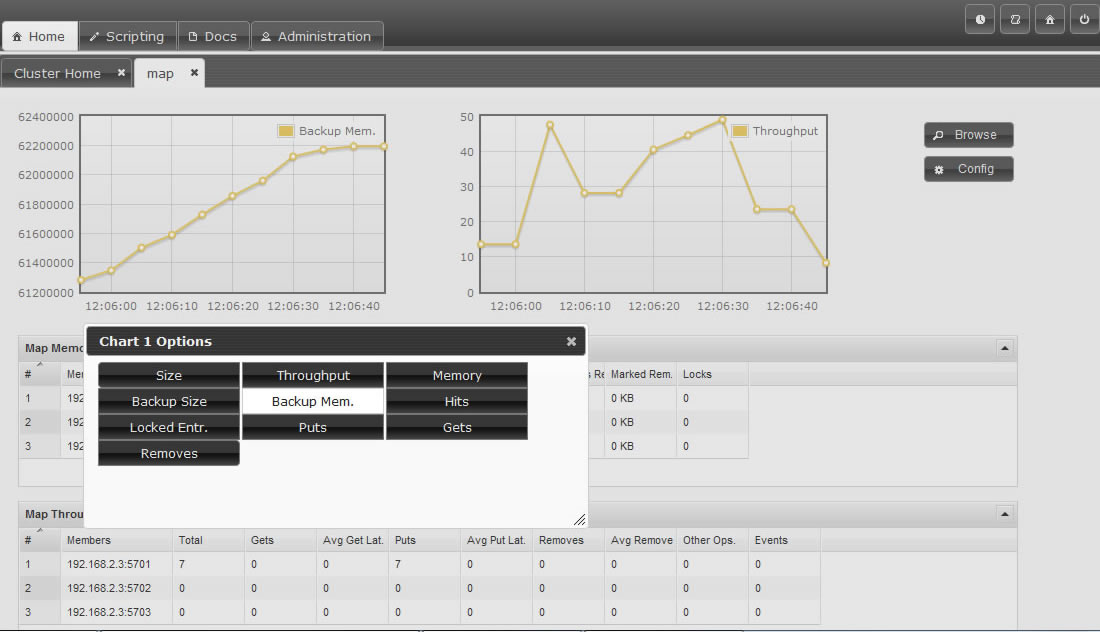
In map page you can monitor instance metrics by 2 charts and 2 datatables. First data table "Memory Data Table" gives the memory metrics distributed over members. "Throughput Data Table" gives information about the operations performed on instance (get, put, remove) Each chart monitors a type data of the instance on cluster. You can change the type by clicking on chart. The possible ones are: Size, Throughput, Memory, Backup Size, Backup Memory, Hits, Locked Entries, Puts, Gets, Removes...

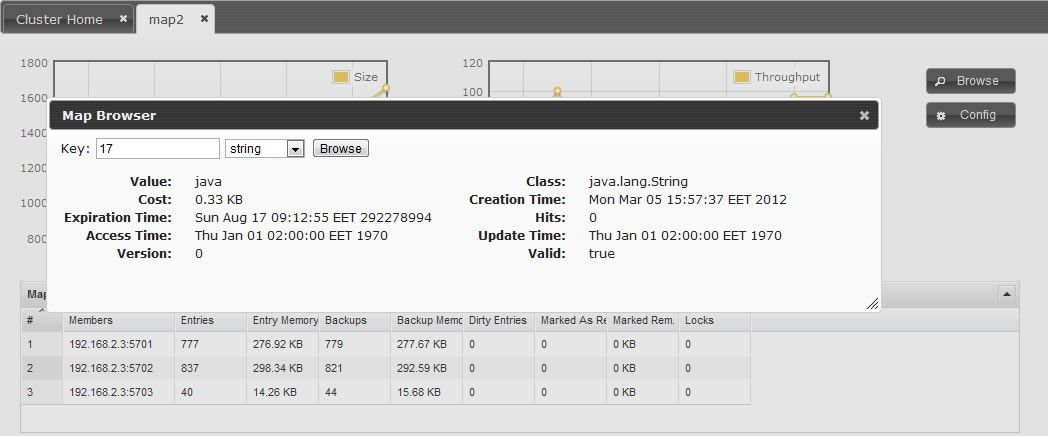
You can open "Map Browser" tool by clicking "Browse" button on map tab page. Using map browser, you can reach map's entries by keys. Besides its value, extra informations such as entry's cost, expiration time is provided.
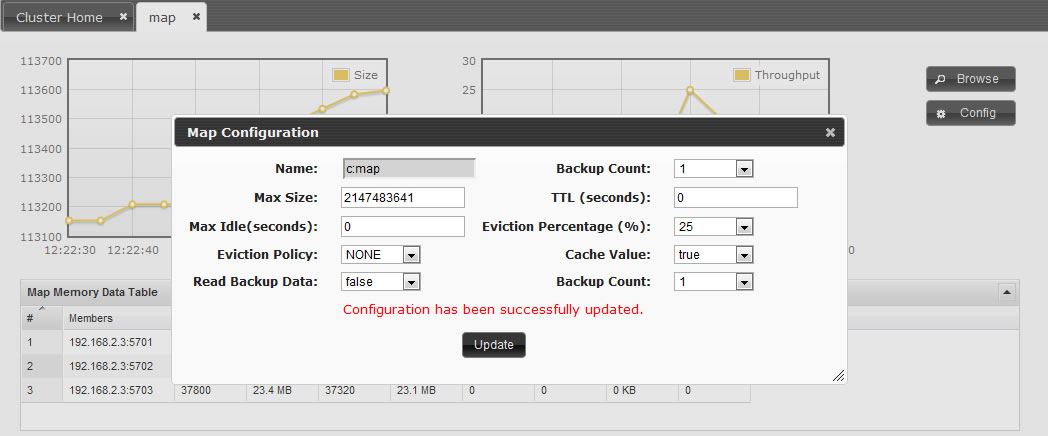
You can open "Map Configuration" tool by clicking "Config" button on map tab page. This button is disabled for users with Read-Only permission. Using map config tool you can adjust map's setting. You can change backup count, max size, max idle(seconds), eviction policy, cache value, read backup data, backup count of the map.

