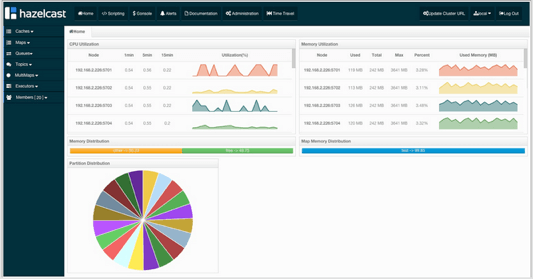
Once the page is loaded after selecting a cluster, the tool's home page appears as shown below.

This page provides the fundamental properties of the selected cluster which are explained in the Home Page section. The page has a toolbar on the top and a menu on the left.
Toolbar

The toolbar has the following buttons:
- Scripting: Loads the page used to write and execute the user`s own scripts on the cluster. Please see the Scripting section.
- Console: Loads the page used to execute commands on the cluster. Please see the Console section.
- Alerts: Creates alerts by specifying filters. Please see the Setting Alerts section.
- Docs: Opens the Management Center documentation in a window inside the tool. Please see the Documentation section.
- Administration: Used by the admin users to manage users in the system. Please see the Administering Management Center section.
- Time Travel: Sees the cluster's situation at a time in the past. Please see the Time Travel section.
-
Operations: Expands a dropdown with the following options:
- Cluster State: Used by the admin users to manage cluster state. Please see the Cluster State section.
- Hot Restart: Used by the admin users to force start or partial start the cluster. Please see the Hot Restart section. This option is visible only if you have configured your license.
- WAN Sync: Used by the admin users to start a WAN sync operation. This option is visible only if you have configured your license.
- Rolling Upgrade: Used by the admin users to change a cluster's version. This option is visible only if you have configured your license.
- Update Cluster URL: Used to change a cluster's Management Center URL.
- Cluster Selector: Switches between clusters. When clicked, a drop down list of clusters appears.
- Logout: Closes the current user's session.

The user can select any cluster and once selected, the page immediately loads with the selected cluster's information.
 NOTE: Some of the above listed toolbar items are not visible to users who are not admin or who have read-only permission. Also, some of the operations explained in the later sections cannot be performed by users with read-only permission. Please see the Administering Management Center section for details.
Menu
The Home Page includes a menu on the left which lists the distributed data structures in the cluster and all the cluster members, as shown below.

 NOTE: Distributed data structures will be shown there when the proxies are created for them.
 NOTE: WAN Replication tab is only visible with Hazelcast IMDG Enterprise license.
You can expand and collapse menu items by clicking on them. Below is the list of menu items with links to their explanations.
Tabbed View
Each time you select an item from the toolbar or menu, the item is added to the main view as a tab, as shown below.

In the above example, Home, Scripting, Console, queue1 and map1 windows can be seen as tabs. Windows can be closed using the ![]() icon on each tab (except the Home Page; it cannot be closed).
icon on each tab (except the Home Page; it cannot be closed).
