To monitor your reliable topics' metrics, click the reliable topic name listed on the left panel under the Reliable Topics menu item. A new tab for monitoring that reliable topic instance opens on the right, as shown below.
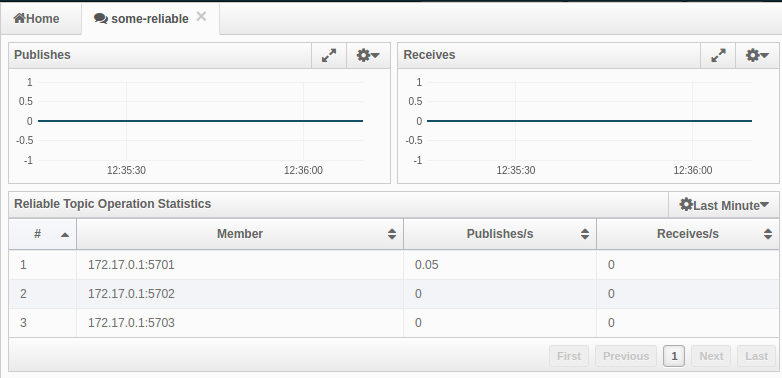
On top of the page, two charts monitor the Publishes and Receives in real-time. They show the published and received message counts of the cluster, the members of which are subscribed to the selected reliable topic. The X-axis of both charts show the current system time. To open a chart as a separate dialog, click on the  button placed at the top right of each chart.
Under these charts is the Reliable Topic Operation Statistics table. From left to right, this table lists the IP addresses and ports of each member, and counts of the messages published and received per second in real-time. You can select the period in the combo box placed at top right corner of the table to show the table data. The available values are Since Beginning, Last Minute, Last 10 Minutes and Last 1 Hour.
You can navigate through the pages using the buttons placed at the bottom right of the table (First, Previous, Next, Last). Click on the column heading to ascend or descend the order of the listings.