WAN Replication schemes are listed under the WAN menu item on the left. When you click on a scheme, a new tab for monitoring the targets which that scheme has appears on the right, as shown below.
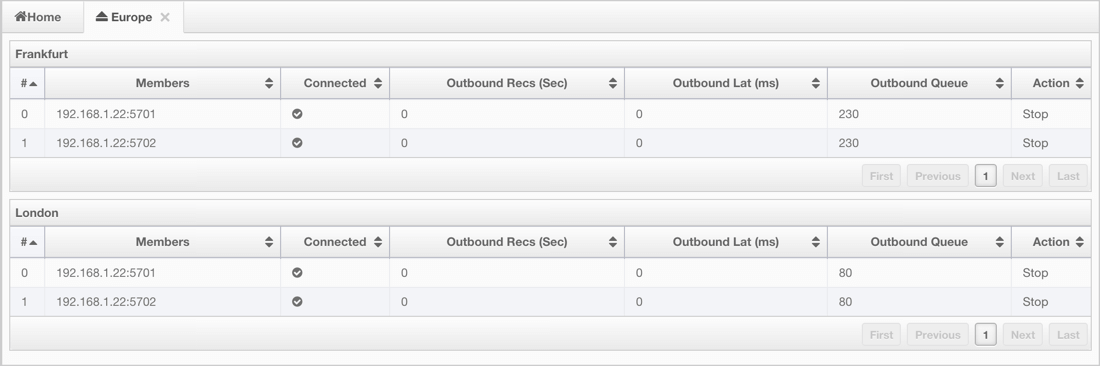
In this tab, you see WAN Replication Operations Table for each target which belongs to this scheme. One of the example tables is shown below.
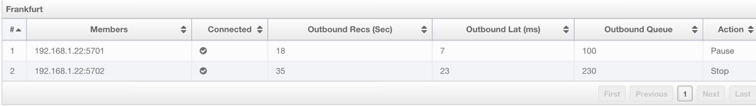
- Connected: Status of the member connection to the target.
- Outbound Recs (sec): Average of event count per second. Please see the paragraph below.
- Outbound Lat (ms): Average latency of sending a record to the target from this member. Please see the paragraph below.
- Outbound Queue: Number of records waiting in the queue to be sent to the target.
- Action: Stops/Resumes replication of this member's records.
Outbound Recs and Outbound Lat are based on the following internal statistics:
- Total published event count (TBEC): Total number of events that are successfully sent to the target cluster since the start-up of the member.
- Total latency (TL): Grand total of each event's waiting time in the queue, including network transmit and receiving ACK from the target.
Each member sends these two statistics to the Management Center at intervals of 3 seconds (update interval). Management Center derives Outbound Recs/s and Outbound Lat from these statistics as formulated below:
Outbound Recs/s = (Current TBEC - Previous TBEC) / Update Interval
Outbound Latency = (Current TL - Previous TL) / Update Interval