Management Center
Hazelcast Management Center enables you to monitor and manage your cluster members running Hazelcast. In addition to monitoring overall state of your clusters, you can also analyze and browse your data structures in detail, update map configurations and take thread dump from members. With its scripting and console module, you can run scripts (JavaScript, Groovy, etc.) and commands on your members.
Installing Management Center
You have two options for installing Hazelcast Management Center. You can either deploy the mancenter-version.war application into your Java application server/container or you can start Hazelcast Management Center from the command line and then have the Hazelcast cluster members communicate with that web application. This means that your members should know the URL of the mancenter application before they start.
Here are the steps.
- Download the latest Hazelcast ZIP from hazelcast.org. The ZIP contains the
mancenter-version.warfile. - You can directly start
mancenter-version.warfile from the command line. The following command will start Hazelcast Management Center on port 8080 with context root 'mancenter' (http://localhost:8080/mancenter).
java -jar mancenter-*version*.war 8080 mancenter
- Or, instead of starting at the command line, you can deploy it to your web server (Tomcat, Jetty, etc.). Let us say it is running at
http://localhost:8080/mancenter. - After you perform the above steps, make sure that
http://localhost:8080/mancenteris up. - Configure your Hazelcast members by adding the URL of your web application to your
hazelcast.xml. Hazelcast members will send their states to this URL.
<management-center enabled="true">
    http://localhost:8080/mancenter
</management-center>
- Start your Hazelcast cluster.
- Browse to
http://localhost:8080/mancenterand setup your administrator account explained in the next section.
Getting Started to Management Center
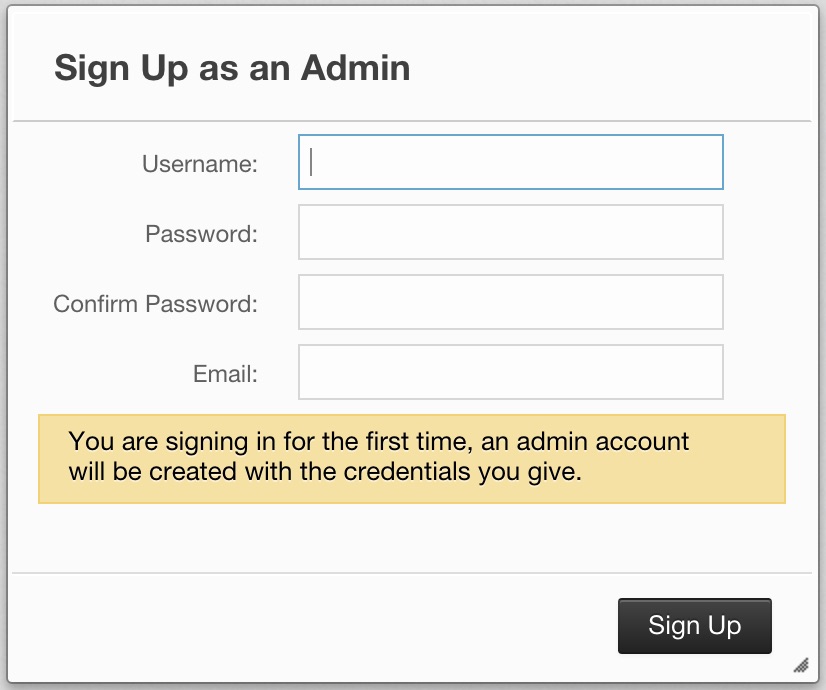
Once you browse to http://localhost:8080/mancenter and since you are going to use Management Center for the first time, the following dialog box appears.
 NOTE: If you already created an administrator account before, a login dialog box appears instead.
It asks you to create a username and password and give a valid e-mail address of yours. Once you press the Sign Up button, your administrator account credentials are created and the following dialog box appears.
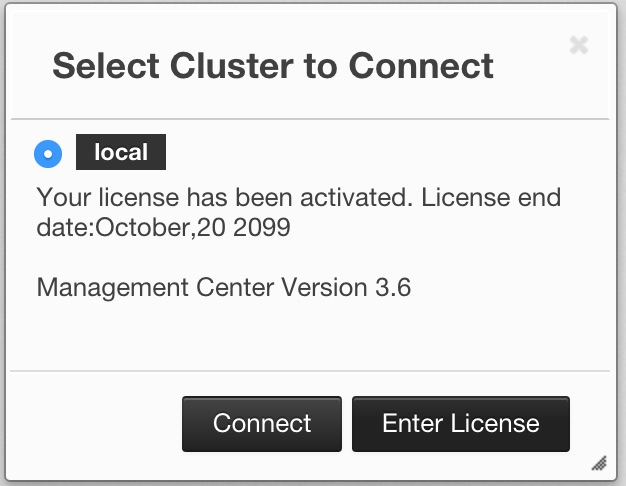
"Select Cluster to Connect" dialog box lists the clusters that send statistics to Management Center. You can either select a cluster to connect using the Connect button or enter your Management Center license key using the Enter License button. Management Center can be used without a license if the cluster that you want to monitor has at most 2 nodes.
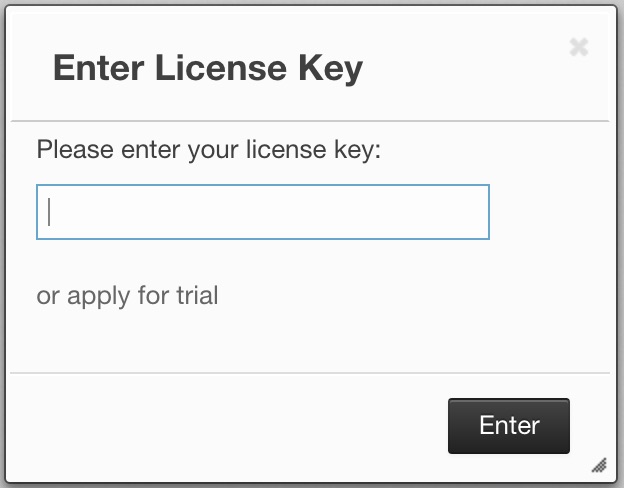
If you have a Management Center license and press the Enter License button, the following dialog box appears.
When you try to connect to a cluster that has more than 2 nodes without entering a license key or if your license key is expired, the following dialog box appears.
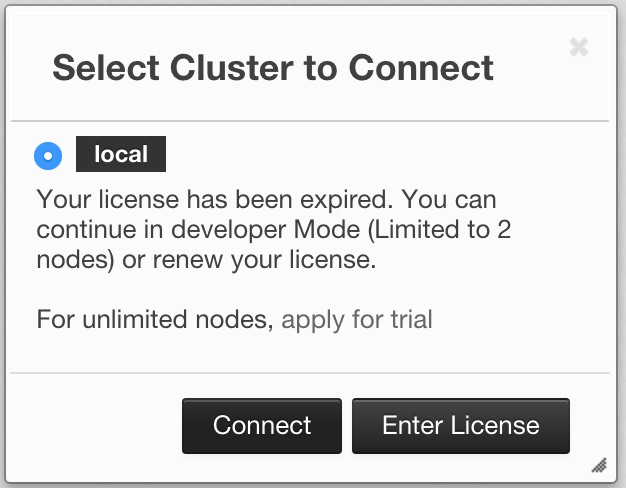
Here, you can either choose to connect to a cluster without providing a license key or to enter your license key. If you choose to continue without a license, Management Center still continues to function but you will only be able to monitor up to 2 nodes of your cluster.
Management Center creates a folder with the name mancenter under your user/home folder to save data files and above settings/license information. You can change the data folder by setting the hazelcast.mancenter.home system property. Please see the System Properties section to see the description of this property and to learn how to set a system property.
RELATED INFORMATION
Please refer to the Management Center Configuration section for a full description of Hazelcast Management Center configuration.
Management Center Tools
Once the page is loaded after selecting a cluster, the tool's home page appears as shown below.
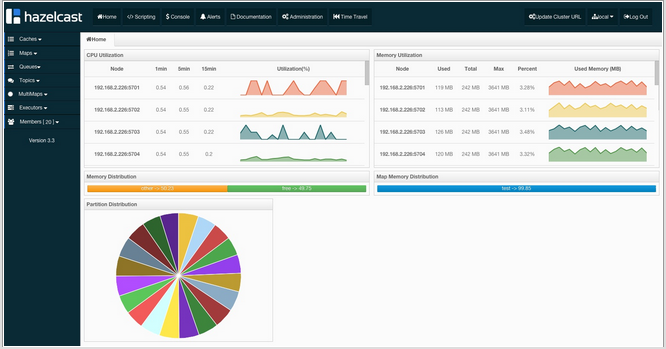
This page provides the fundamental properties of the selected cluster which are explained in the Home Page section. The page has a toolbar on the top and a menu on the left.
Toolbar

The toolbar has the following buttons:
- Home: Loads the home page shown above. Please see Management Center Home Page.
- Scripting: Loads the page used to write and execute the user`s own scripts on the cluster. Please see the Scripting section.
- Console: Loads the page used to execute commands on the cluster. Please see the Console section.
- Alerts: Creates alerts by specifying filters. Please see Setting Alerts.
- Documentation: Opens the Management Center documentation in a window inside the tool. Please see the Documentation section.
- Administration: Used by the admin users to manage users in the system. Please see Administering - Management Center.
- Logout: Closes the current user's session.
- Hot Restart: Used by the admin users to manage cluster state. Please see Hot Restart.
- Time Travel: Sees the cluster's situation at a time in the past. Please see the Time Travel section.
Cluster Selector: Switches between clusters. When the mouse is moved onto this item, a drop down list of clusters appears.
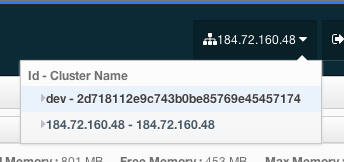
The user can select any cluster and once selected, the page immediately loads with the selected cluster's information.
NOTE: Some of the above listed toolbar items are not visible to users who are not admin or who have read-only permission. Also, some of the operations explained in the later sections cannot be performed by users with read-only permission. Please see the Administration section for details.
Menu
The Home Page includes a menu on the left which lists the distributed data structures in the cluster and all the cluster members, as shown below.
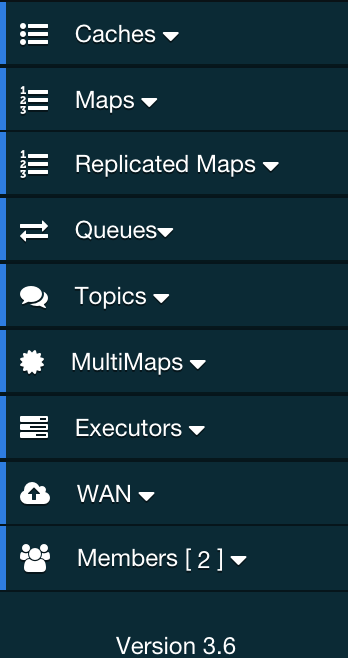
NOTE: Distributed data structures will be shown there when the proxies are created for them.
NOTE: WAN Replication tab is only visible with enterprise license.
You can expand and collapse menu items by clicking on them. Below is the list of menu items with links to their explanations.
Tabbed View
Each time you select an item from the toolbar or menu, the item is added to the main view as a tab, as shown below.
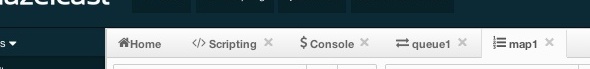
In the above example, Home, Scripting, Console, queue1 and map1 windows can be seen as tabs. Windows can be closed using the  icon on each tab (except the Home Page; it cannot be closed).
Management Center Home Page
This is the first page appearing after logging in. It gives an overview of the connected cluster. The following subsections describe each portion of the page.
CPU Utilization
This part of the page provides load and utilization information for the CPUs for each node (cluster member), as shown below.
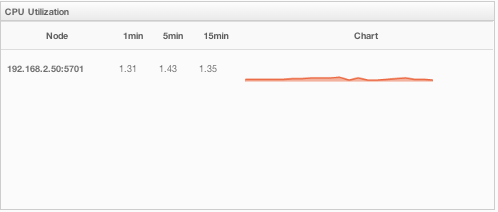
The first column lists the nodes with their IPs and ports. The next columns list the system load averages on each node for the last 1, 5 and 15 minutes. These average values are calculated as the sum of the count of runnable entities running on and queued to the available CPUs averaged over the last 1, 5 and 15 minutes. This calculation is operating system specific, typically a damped time-dependent average. If system load average is not available, these columns show negative values.
The last column (Chart) graphically shows the recent load on the CPUs. When you move the mouse cursor on a chart, you can see the CPU load at the time where the cursor is placed. Charts under this column shows the CPU loads approximately for the last 2 minutes. If recent CPU load is not available, you will see a negative value.
Memory Utilization
This part of the page provides information related to memory usages for each node (cluster member), as shown below.
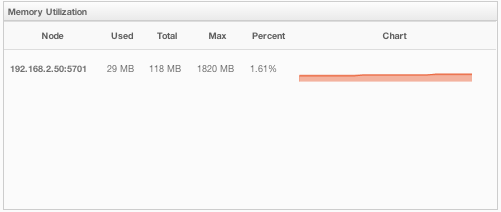
The first column lists the nodes with their IPs and ports. The next columns show the used and free memories out of the total memory reserved for Hazelcast usage, in real-time. The Max column lists the maximum memory capacity of each node and the Percent column lists the percentage value of used memory out of the maximum memory. The last column (Chart) shows the memory usage of nodes graphically. When you move the mouse cursor on a desired graph, you can see the memory usage at the time where the cursor is placed. Graphs under this column shows the memory usages approximately for the last 2 minutes.
Memory Distribution
This part of the page graphically provides the cluster wise breakdown of memory, as shown below. The blue area is the memory used by maps. The dark yellow area is the memory used by both non-Hazelcast entities and all Hazelcast entities except the map (i.e. the memory used by all entities subtracted by the memory used by map). The green area is the free memory out of the whole cluster`s memory capacity.

In the above example, you can see 0.32% of the total memory is used by Hazelcast maps (it can be seen by placing the mouse cursor on it), 58.75% is used by non-Hazelcast entities and 40.85% of the total memory is free.
Map Memory Distribution
This part is the breakdown of the blue area shown in the Memory Distribution graph explained above. It provides the percentage values of the memories used by each map, out of the total cluster memory reserved for all Hazelcast maps.

In the above example, you can see 49.55% of the total map memory is used by map1 and 49.55% is used by map2.
Partition Distribution
This pie chart shows what percentage of partitions each node (cluster member) has, as shown below.
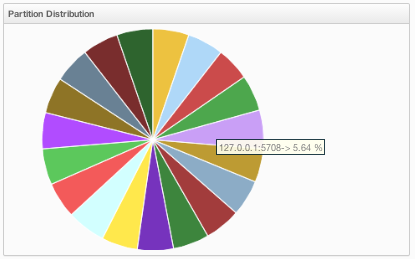
You can see each node's partition percentages by placing the mouse cursor on the chart. In the above example, you can see the node "127.0.0.1:5708" has 5.64% of the total partition count (which is 271 by default and configurable, please see the hazelcast.partition.count property explained in the System Properties section).
Monitoring Caches
You can monitor your caches' metrics by clicking the cache name listed on the left panel under Caches menu item. A new tab for monitoring that cache instance is opened on the right, as shown below.
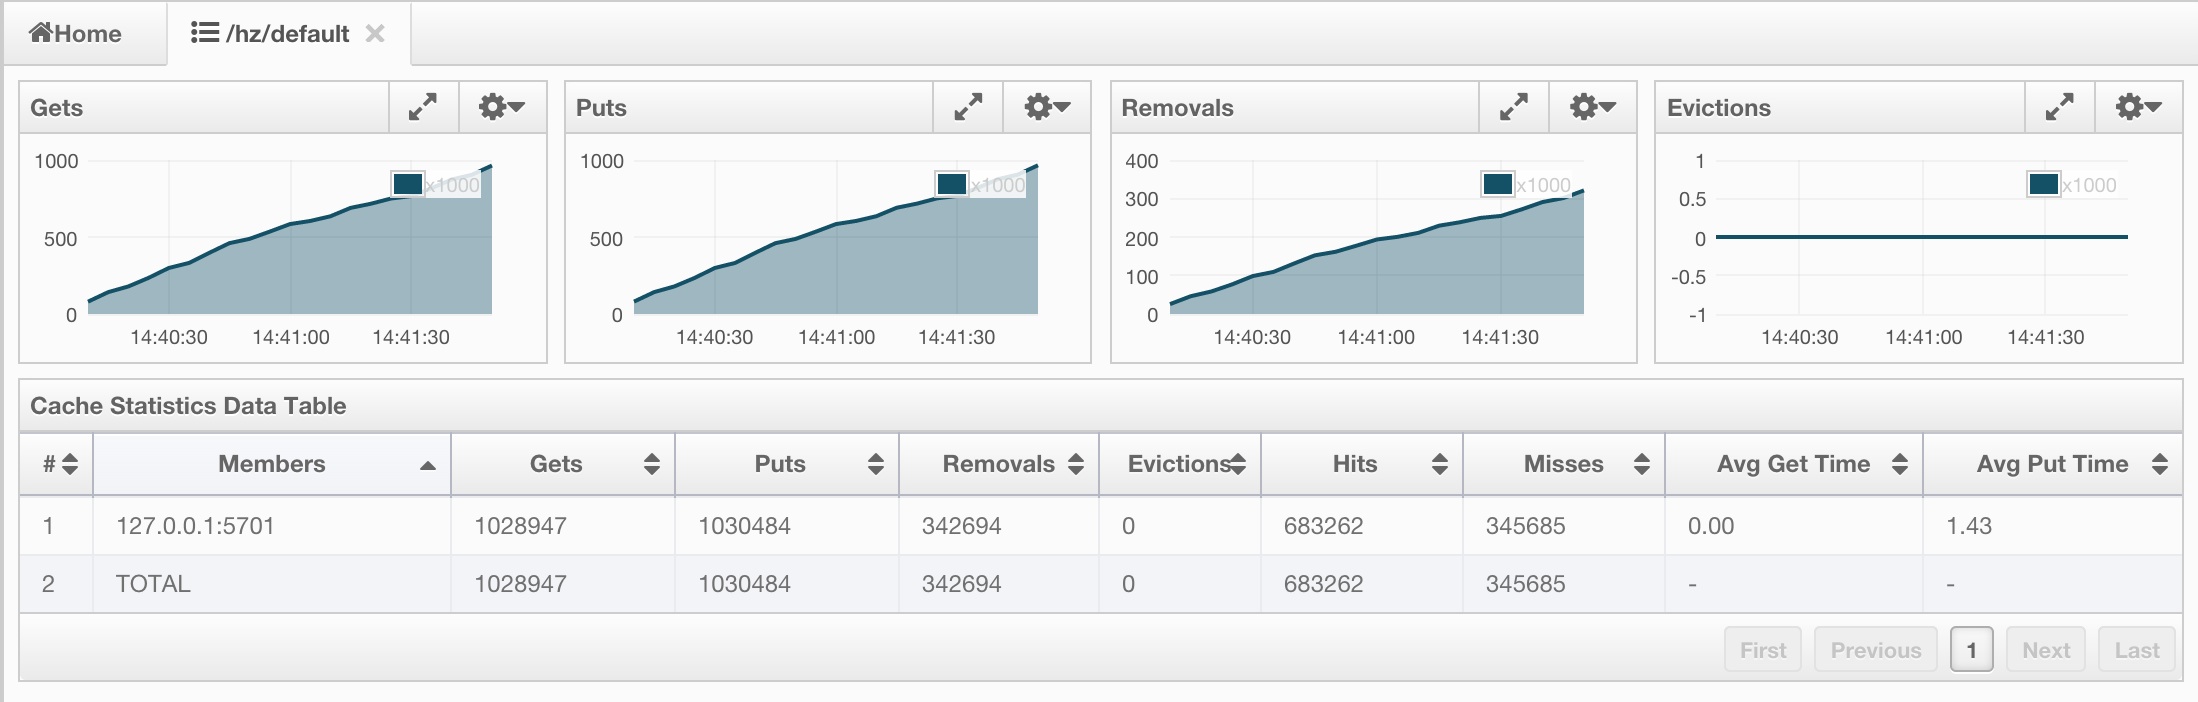
On top of the page, four charts monitor the Gets, Puts, Removals and Evictions in real-time. The X-axis of all the charts show the current system time. To open a chart as a separate dialog, click on the  button placed at the top right of each chart.
Under these charts is the Cache Statistics Data Table. From left to right, this table lists the IP addresses and ports of each member, and the get, put, removal, eviction, and hit and miss counts per second in real-time.
You can navigate through the pages using the buttons at the bottom right of the table (First, Previous, Next, Last). You can ascend or descend the order of the listings in each column by clicking on column headings.
NOTE: You need to enable the statistics for caches to monitor them in the Management Center. Use the <statistics-enabled> element or setStatisticsEnabled() method in declarative or programmatic configuration, respectively, to enable the statistics. Please refer to the [Cache Configuration section] for more information.
Managing Maps
Map instances are listed under the Maps menu item on the left. When you click on a map, a new tab for monitoring that map instance opens on the right, as shown below. In this tab, you can monitor metrics and also re-configure the selected map.
The below subsections explain the portions of this window.
Map Browser
Use the Map Browser tool to retrieve properties of the entries stored in the selected map. To open the Map Browser tool, click on the Map Browser button, located at the top right of the window. Once opened, the tool appears as a dialog, as shown below.
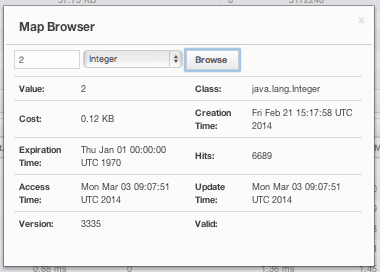
Once the key and the key's type are specified and the Browse button is clicked, the key's properties along with its value are listed.
Map Config
Use the Map Config tool to set the selected map's attributes, such as the backup count, TTL, and eviction policy. To open the Map Config tool, click on the Map Config button, located at the top right of the window. Once opened, the tool appears as a dialog, as shown below.
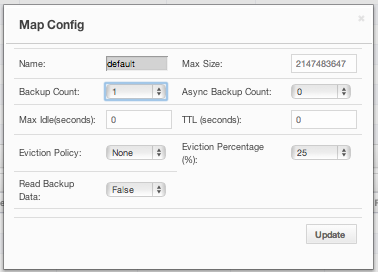
You can change any attribute and click the Update button to save your changes.
Map Monitoring
Besides the Map Browser and Map Config tools, the map monitoring page has monitoring options that are explained below. All of these options perform real-time monitoring.
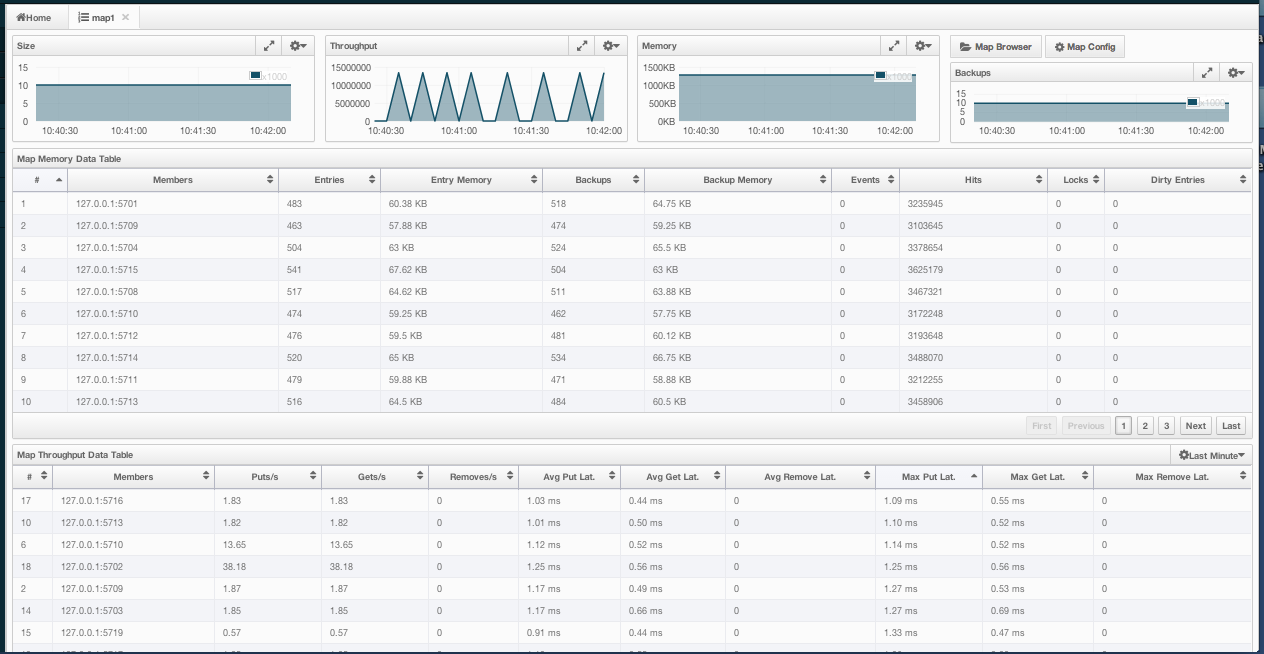
On top of the page, small charts monitor the size, throughput, memory usage, backup size, etc. of the selected map in real-time. The X-axis of all the charts show the current system time. You can select other small monitoring charts using the  button at the top right of each chart. When you click the button, the monitoring options are listed, as shown below.
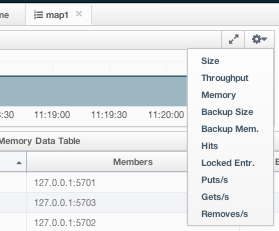
When you click on a desired monitoring, the chart is loaded with the selected option. To open a chart as a separate dialog, click on the button placed at the top right of each chart. The monitoring charts below are available:
- Size: Monitors the size of the map. Y-axis is the entry count (should be multiplied by 1000).
- Throughput: Monitors get, put and remove operations performed on the map. Y-axis is the operation count.
- Memory: Monitors the memory usage on the map. Y-axis is the memory count.
- Backups: Chart loaded when "Backup Size" is selected. Monitors the size of the backups in the map. Y-axis is the backup entry count (should be multiplied by 1000).
- Backup Memory: Chart loaded when "Backup Mem." is selected. Monitors the memory usage of the backups. Y-axis is the memory count.
- Hits: Monitors the hit count of the map.
- Puts/s, Gets/s, Removes/s: These three charts monitor the put, get and remove operations (per second) performed on the selected map.
Under these charts are Map Memory and Map Throughput data tables. The Map Memory data table provides memory metrics distributed over members, as shown below.
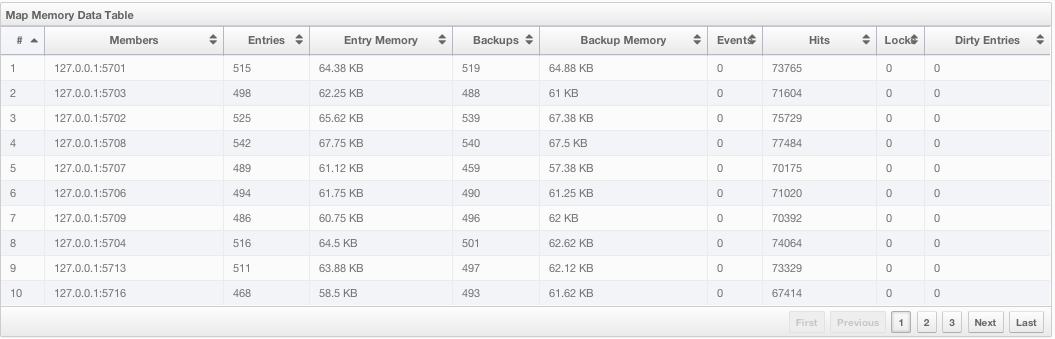
From left to right, this table lists the IP address and port, entry counts, memory used by entries, backup entry counts, memory used by backup entries, events, hits, locks and dirty entries (in the cases where MapStore is enabled, these are the entries that are put to/removed from the map but not written to/removed from a database yet) of each entry in the map. You can navigate through the pages using the buttons at the bottom right of the table (First, Previous, Next, Last). You can ascend or descend the order of the listings by clicking on the column headings.
Map Throughput data table provides information about the operations (get, put, remove) performed on each member in the map, as shown below.
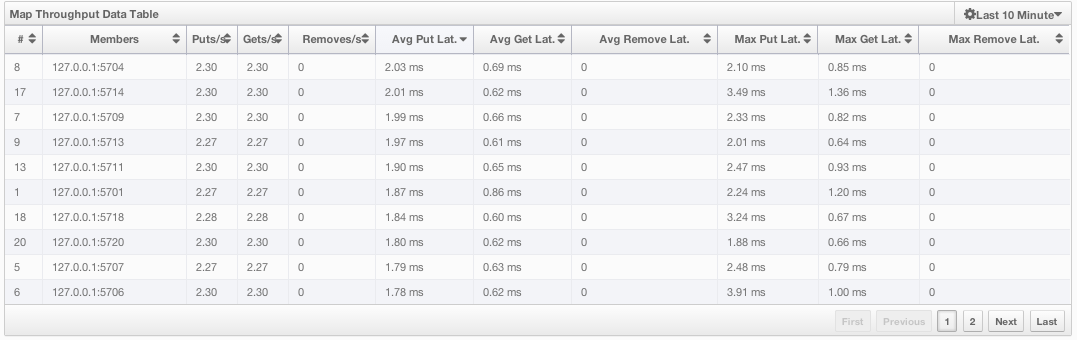
From left to right, this table lists:
- the IP address and port of each member,
- the put, get and remove operations on each member,
- the average put, get, remove latencies,
- and the maximum put, get, remove latencies on each member.
You can select the period in the combo box placed at the top right corner of the window, for which the table data will be shown. Available values are Since Beginning, Last Minute, Last 10 Minutes and Last 1 Hour.
You can navigate through the pages using the buttons placed at the bottom right of the table (First, Previous, Next, Last). To ascend or descent the order of the listings, click on the column headings.
Monitoring Replicated Maps
Replicated Map instances are shown under the Replicated Maps menu item on the left. When you click on a Replicated Map, a new tab for monitoring that instance opens on the right, as shown below.
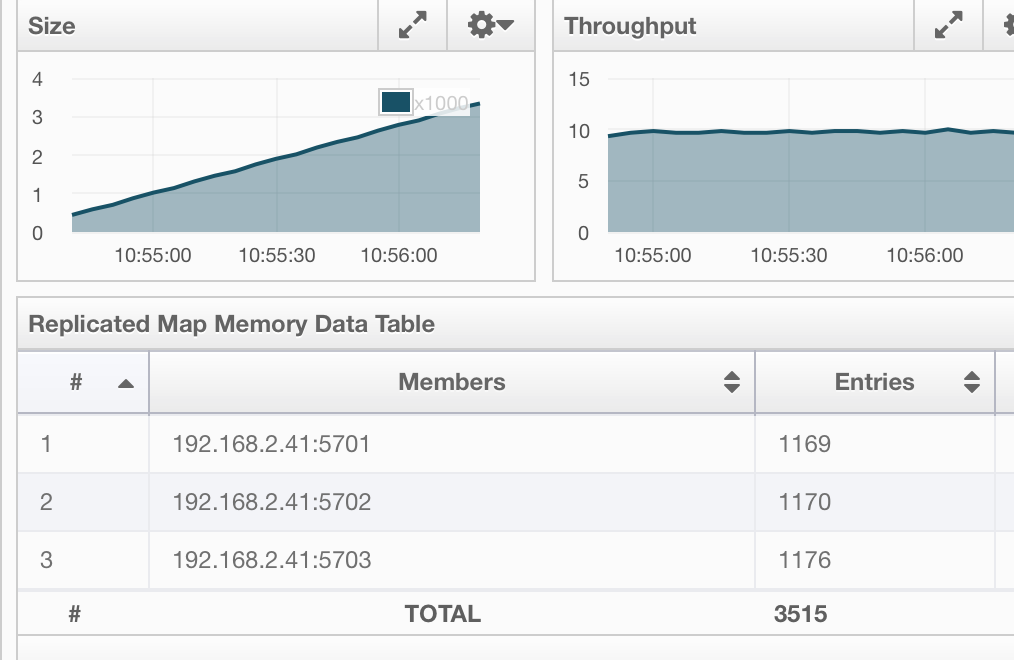
In this tab, you can monitor metrics and also re-configure the selected Replicated Map. All of the statistics are real-time monitoring statistics.
When you click on a desired monitoring, the chart is loaded with the selected option. Also you can open the chart in new window.
- Size: Monitors the size of the Replicated Map. Y-axis is the entry count (should be multiplied by 1000).
- Throughput: Monitors get, put and remove operations performed on the Replicated Map. Y-axis is the operation count.
- Memory: Monitors the memory usage on the Replicated Map. Y-axis is the memory count.
- Hits: Monitors the hit count of the Replicated Map.
- Puts/s, Gets/s, Removes/s: These three charts monitor the put, get and remove operations (per second) performed on the selected Replicated Map, the average put, get, remove latencies, and the maximum put, get, remove latencies on each member.
The Replicated Map Throughput Data Table provides information about operations (get, put, remove) performed on each member in the selected Replicated Map.
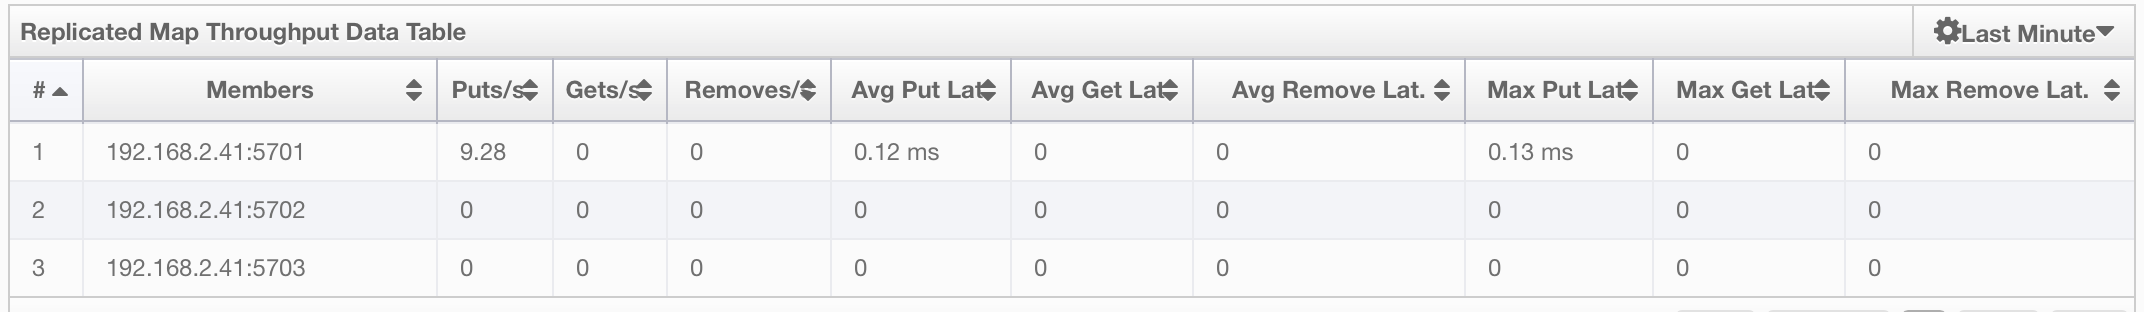
From left to right, this table lists:
- the IP address and port of each member,
- the put, get, and remove operations on each member,
- the average put, get, and remove latencies,
- and the maximum put, get, and remove latencies on each member.
You can select the period from the combo box placed at the top right corner of the window, in which the table data is shown. Available values are Since Beginning, Last Minute, Last 10 Minutes and Last 1 Hour.
You can navigate through the pages using the buttons placed at the bottom right of the table (First, Previous, Next, Last). To ascend or descent the order of the listings, click on the column headings.
Monitoring Queues
Using the menu item Queues, you can monitor your queues data structure. When you expand this menu item and click on a queue, a new tab for monitoring that queue instance is opened on the right, as shown below.
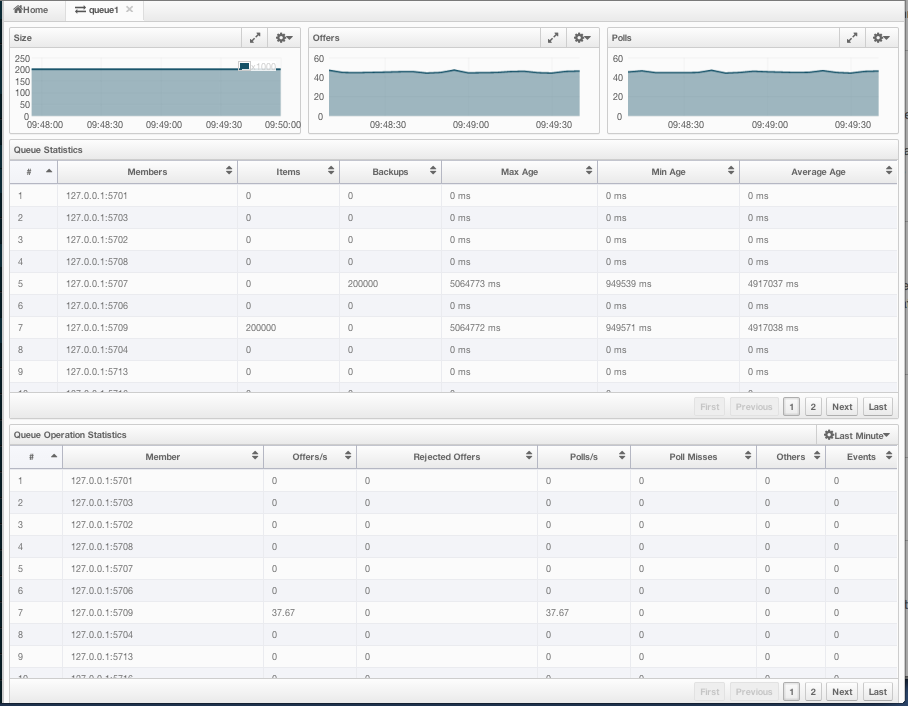
On top of the page, small charts monitor the size, offers and polls of the selected queue in real-time. The X-axis of all the charts shows the current system time. To open a chart as a separate dialog, click on the button placed at the top right of each chart. The monitoring charts below are available:
- Size: Monitors the size of the queue. Y-axis is the entry count (should be multiplied by 1000).
- Offers: Monitors the offers sent to the selected queue. Y-axis is the offer count.
- Polls: Monitors the polls sent to the selected queue. Y-axis is the poll count.
Under these charts are Queue Statistics and Queue Operation Statistics tables. The Queue Statistics table provides item and backup item counts in the queue and age statistics of items and backup items at each member, as shown below.
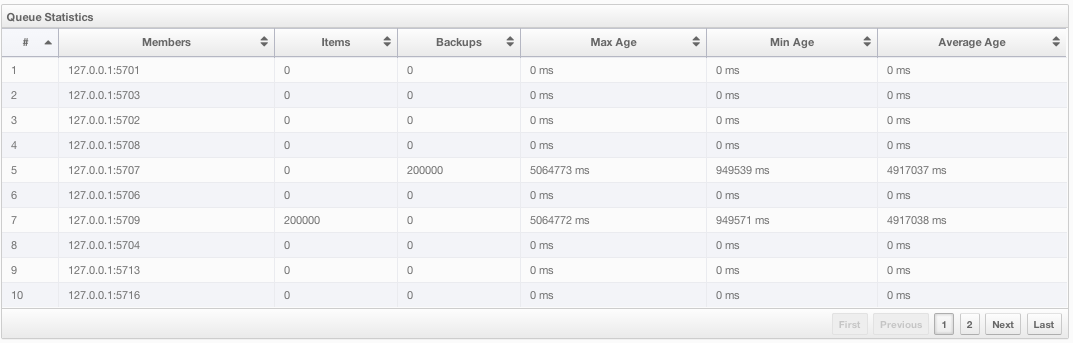
From left to right, this table lists the IP address and port, items and backup items on the queue of each member, and maximum, minimum and average age of items in the queue. You can navigate through the pages using the buttons placed at the bottom right of the table (First, Previous, Next, Last). The order of the listings in each column can be ascended or descended by clicking on column headings.
Queue Operations Statistics table provides information about the operations (offers, polls, events) performed on the queues, as shown below.
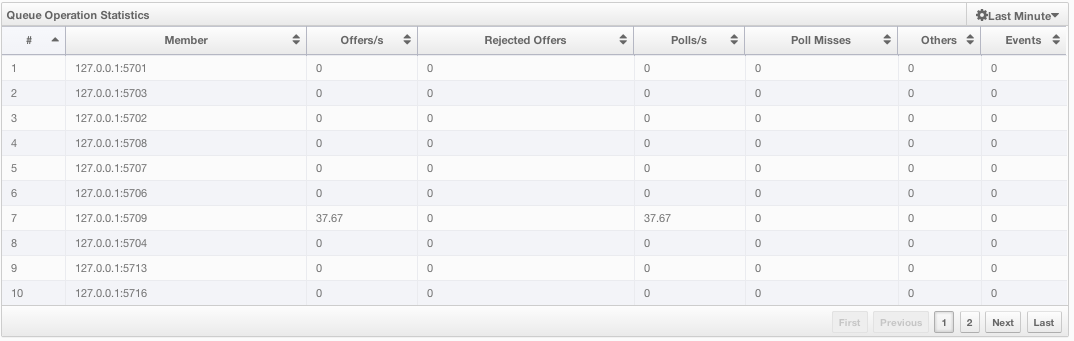
From left to right, this table lists the IP address and port of each member, and counts of offers, rejected offers, polls, poll misses and events.
You can select the period in the combo box placed at the top right corner of the window to show the table data. Available values are Since Beginning, Last Minute, Last 10 Minutes and Last 1 Hour.
You can navigate through the pages using the buttons placed at the bottom right of the table (First, Previous, Next, Last). Click on the column headings to ascend or descend the order of the listings.
Monitoring Topics
To monitor your topics' metrics, click the topic name listed on the left panel under the Topics menu item. A new tab for monitoring that topic instance opens on the right, as shown below.
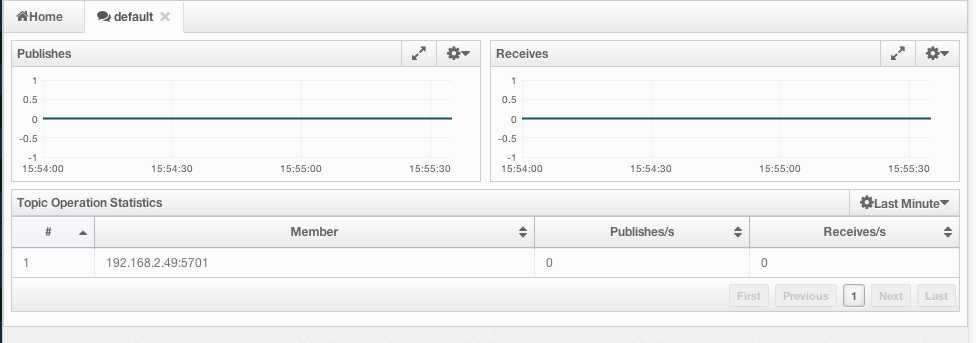
On top of the page, two charts monitor the Publishes and Receives in real-time. They show the published and received message counts of the cluster, the members of which are subscribed to the selected topic. The X-axis of both charts show the current system time. To open a chart as a separate dialog, click on the button placed at the top right of each chart.
Under these charts is the Topic Operation Statistics table. From left to right, this table lists the IP addresses and ports of each member, and counts of message published and receives per second in real-time. You can select the period in the combo box placed at top right corner of the table to show the table data. The available values are Since Beginning, Last Minute, Last 10 Minutes and Last 1 Hour.
You can navigate through the pages using the buttons placed at the bottom right of the table (First, Previous, Next, Last). Click on the column heading to ascend or descend the order of the listings.
Monitoring MultiMaps
MultiMap is a specialized map where you can associate a key with multiple values. This monitoring option is similar to the Maps option: the same monitoring charts and data tables monitor MultiMaps. The differences are that you cannot browse the MultiMaps and re-configure it. Please see Managing Maps.
Monitoring Executors
Executor instances are listed under the Executors menu item on the left. When you click on a executor, a new tab for monitoring that executor instance opens on the right, as shown below.
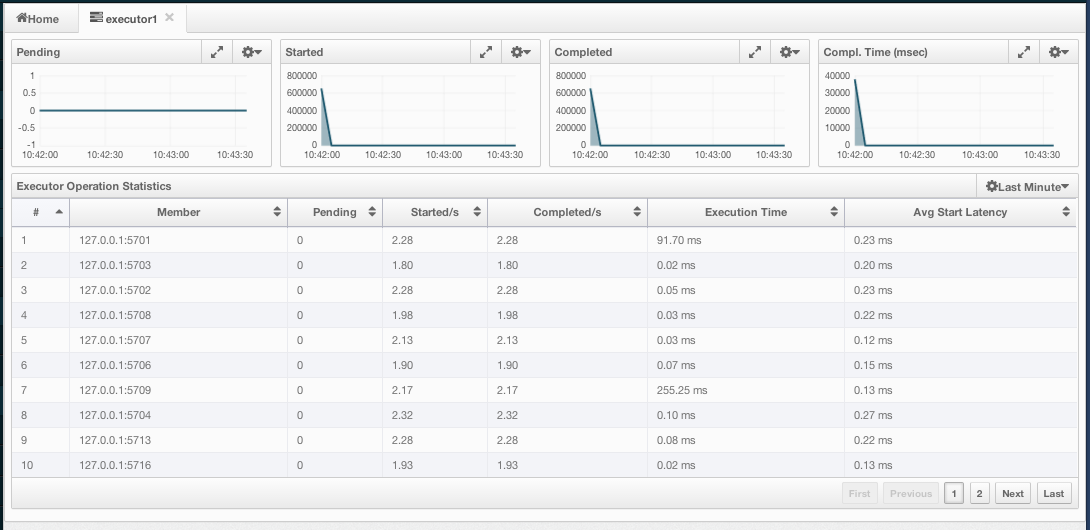
On top of the page, small charts monitor the pending, started, completed, etc. executors in real-time. The X-axis of all the charts shows the current system time. You can select other small monitoring charts using the button placed at the top right of each chart. Click the button to list the monitoring options, as shown below.
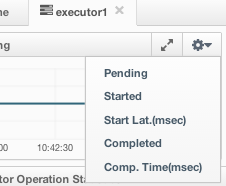
When you click on a desired monitoring, the chart loads with the selected option. To open a chart as a separate dialog, click on the button placed at top right of each chart. The below monitoring charts are available:
- Pending: Monitors the pending executors. Y-axis is the executor count.
- Started: Monitors the started executors. Y-axis is the executor count.
- Start Lat. (msec.): Shows the latency when executors are started. Y-axis is the duration in milliseconds.
- Completed: Monitors the completed executors. Y-axis is the executor count.
- Comp. Time (msec.): Shows the completion period of executors. Y-axis is the duration in milliseconds.
Under these charts is the Executor Operation Statistics table, as shown below.
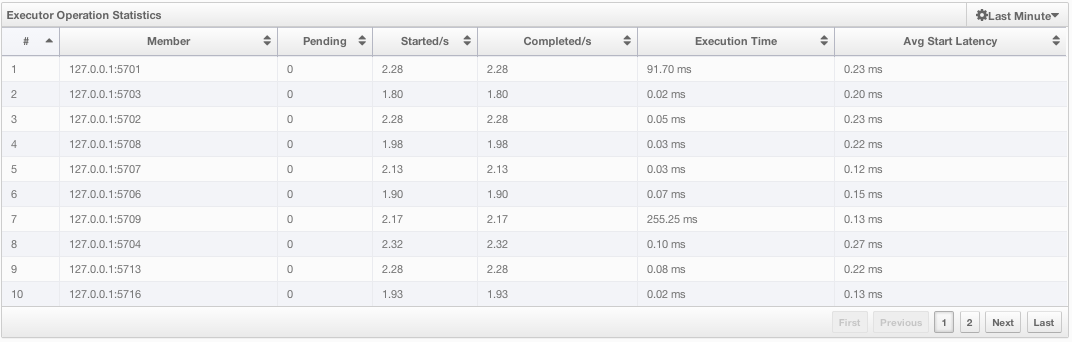
From left to right, this table lists the IP address and port of members, the counts of pending, started and completed executors per second, and the execution time and average start latency of executors on each member. You can navigate through the pages using the buttons placed at the bottom right of the table (First, Previous, Next, Last). Click on the column heading to ascend or descend the order of the listings.
Monitoring WAN Replication
WAN Replication schemes are listed under the WAN menu item on the left. When you click on a scheme, a new tab for monitoring the targets which that scheme has appears on the right, as shown below.
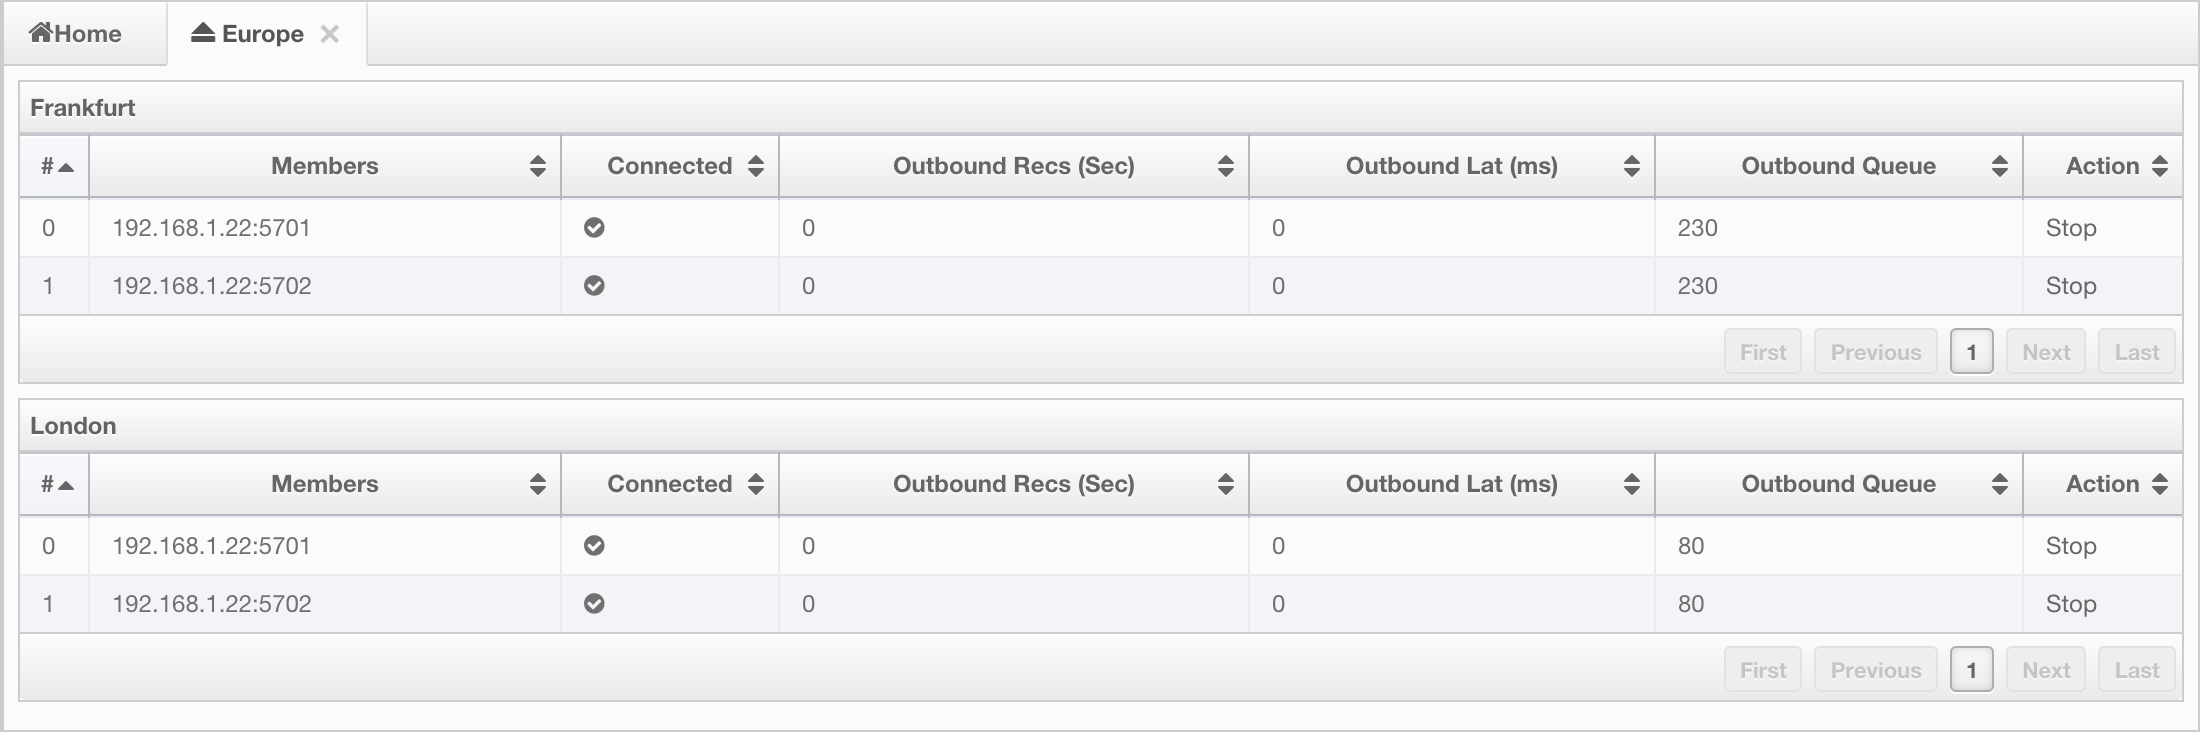
In this tab, you see WAN Replication Operations Table for each target which belongs to this scheme. One of the example tables is shown below.
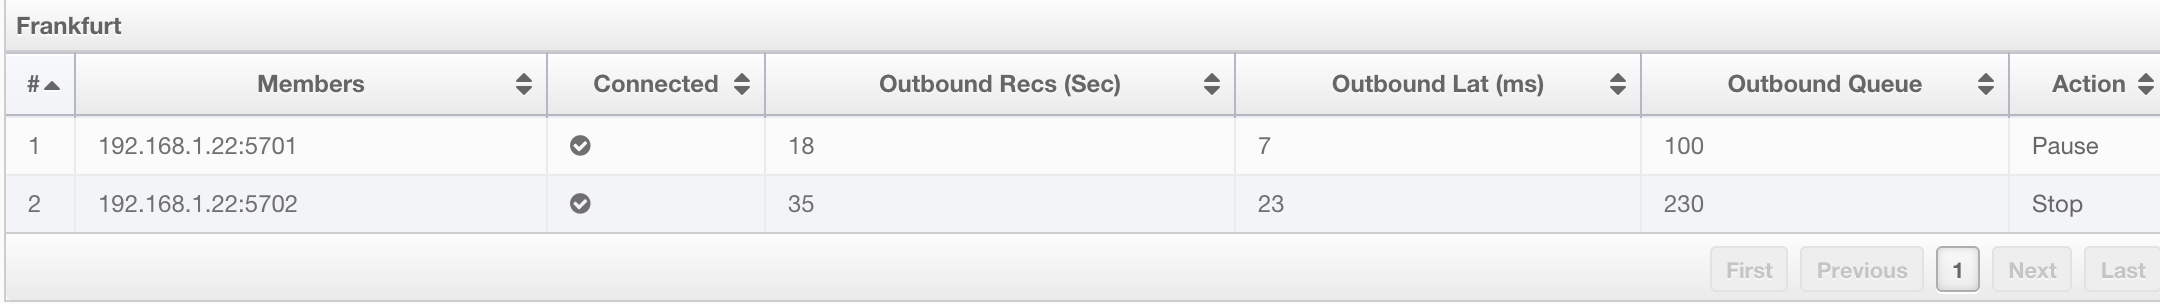
- Connected: Status of the member connection to the target.
- Outbound Recs (sec): Average number of records sent to target per second from this member.
- Outbound Lat (ms): Average latency of sending a record to the target from this member.
- Outbound Queue: Number of records waiting in the queue to be sent to the target.
- Action: Stops/Resumes replication of this member's records.
Monitoring Members
Use this menu item to monitor each cluster member and perform operations like running garbage collection (GC) and taking a thread dump. Once you select a member from the menu, a new tab for monitoring that member opens on the right, as shown below.
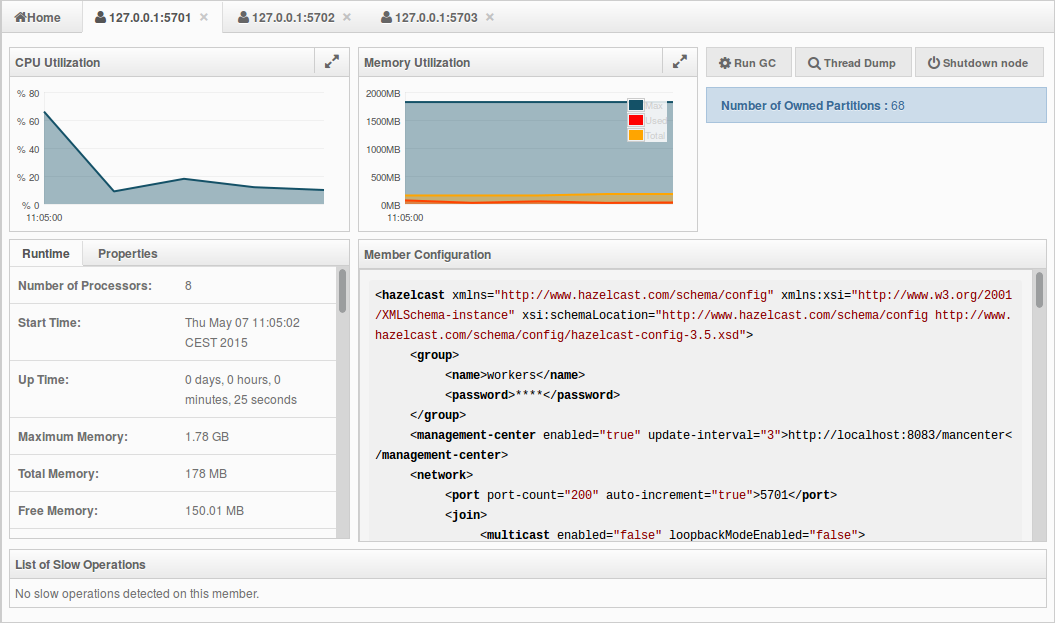
The CPU Utilization chart shows the percentage of CPU usage on the selected member. The Memory Utilization chart shows the memory usage on the selected member with three different metrics (maximum, used and total memory). You can open both of these charts as separate windows using the button placed at top right of each chart; this gives you a clearer view of the chart.
The window titled Partitions shows which partitions are assigned to the selected member. Runtime is a dynamically updated window tab showing the processor number, the start and up times, and the maximum, total and free memory sizes of the selected member. These values are collected from the default MXBeans provided by the Java Virtual Machine (JVM). Descriptions from the Javadocs and some explanations are below:
Number of Processors: Number of processors available to the member (JVM).
Start Time: Start time of the member (JVM) in milliseconds.
Up Time: Uptime of the member (JVM) in milliseconds
Maximum Memory: Maximum amount of memory that the member (JVM) will attempt to use.
Free Memory: Amount of free memory in the member (JVM).
Used Heap Memory: Amount of used memory in bytes.
Max Heap Memory: Maximum amount of memory in bytes that can be used for memory management.
Used Non-Heap Memory: Amount of used memory in bytes.
Max Non-Heap Memory: Maximum amount of memory in bytes that can be used for memory management.
Total Loaded Classes: Total number of classes that have been loaded since the member (JVM) has started execution.
Current Loaded Classes: Number of classes that are currently loaded in the member (JVM).
Total Unloaded Classes: Total number of classes unloaded since the member (JVM) has started execution.
Total Thread Count: Total number of threads created and also started since the member (JVM) started.
Active Thread Count: Current number of live threads including both daemon and non-daemon threads.
Peak Thread Count: Peak live thread count since the member (JVM) started or peak was reset.
Daemon Thread Count: Current number of live daemon threads.
OS: Free Physical Memory: Amount of free physical memory in bytes.
OS: Committed Virtual Memory: Amount of virtual memory that is guaranteed to be available to the running process in bytes.
OS: Total Physical Memory: Total amount of physical memory in bytes.
OS: Free Swap Space: Amount of free swap space in bytes. Swap space is used when the amount of physical memory (RAM) is full. If the system needs more memory resources and the RAM is full, inactive pages in memory are moved to the swap space.
OS: Total Swap Space: Total amount of swap space in bytes.
OS: Maximum File Descriptor Count: Maximum number of file descriptors. File descriptor is an integer number that uniquely represents an opened file in the operating system.
OS: Open File Descriptor Count: Number of open file descriptors.
OS: Process CPU Time: CPU time used by the process on which the member (JVM) is running in nanoseconds.
OS: Process CPU Load: Recent CPU usage for the member (JVM) process. This is a double with a value from 0.0 to 1.0. A value of 0.0 means that none of the CPUs were running threads from the member (JVM) process during the recent period of time observed, while a value of 1.0 means that all CPUs were actively running threads from the member (JVM) 100% of the time during the recent period being observed. Threads from the member (JVM) include the application threads as well as the member (JVM) internal threads.
OS: System Load Average: System load average for the last minute. The system load average is the average over a period of time of this sum: (the number of runnable entities queued to the available processors) + (the number of runnable entities running on the available processors). The way in which the load average is calculated is operating system specific but it is typically a damped time-dependent average.
OS: System CPU Load: Recent CPU usage for the whole system. This is a double with a value from 0.0 to 1.0. A value of 0.0 means that all CPUs were idle during the recent period of time observed, while a value of 1.0 means that all CPUs were actively running 100% of the time during the recent period being observed.
NOTE: These descriptions may vary according to the JVM version or vendor.
Next to the Runtime tab, the Properties tab shows the system properties. The Member Configuration window shows the XML configuration of the connected Hazelcast cluster.
The List of Slow Operations gives an overview of detected slow operations which occurred on that member. The data is collected by the SlowOperationDetector.
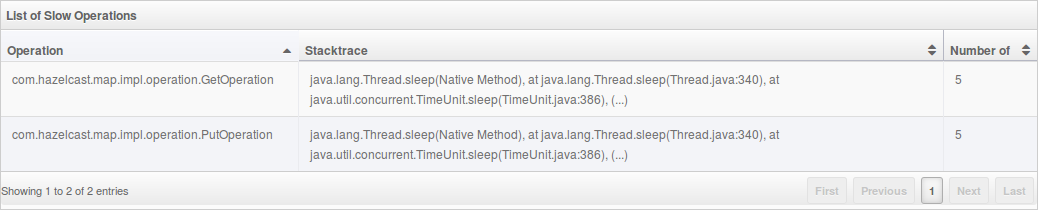
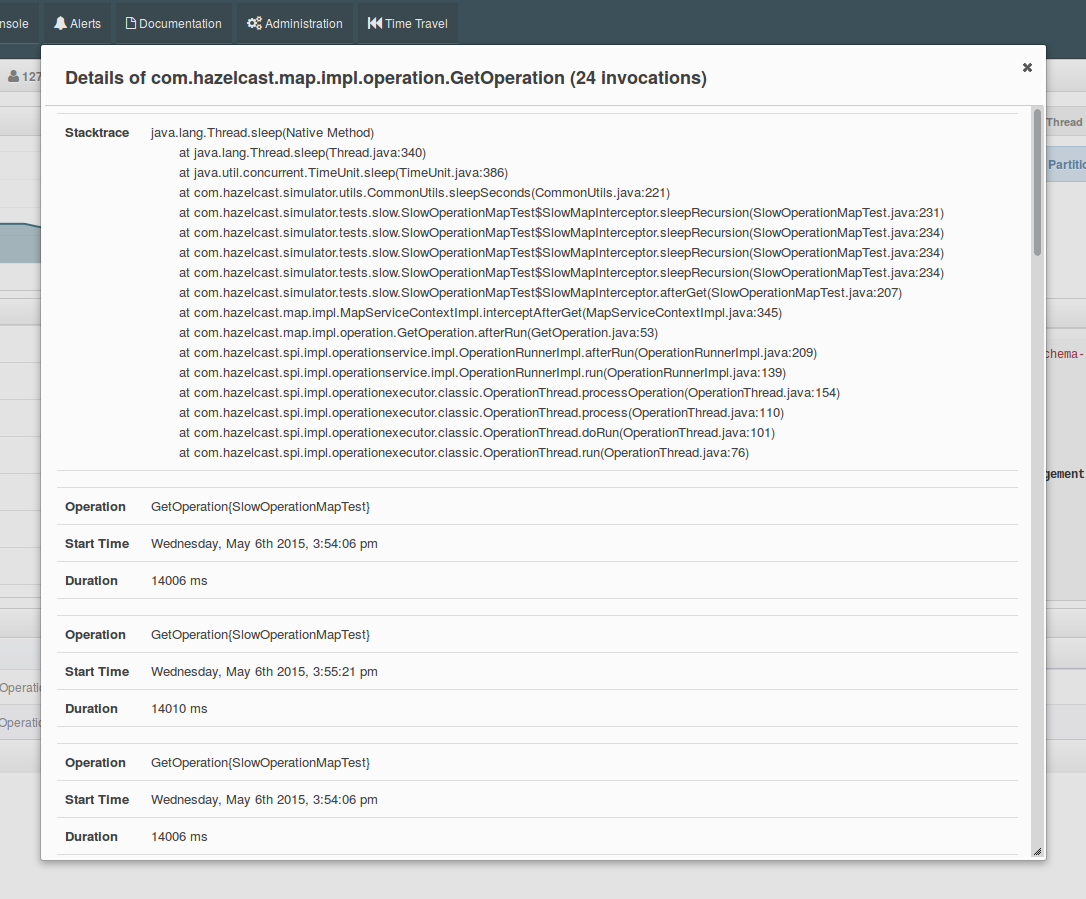
Click on an entry to open a dialog which shows the stacktrace and detailed information about each slow invocation of this operation.
Besides the aforementioned monitoring charts and windows, you can also perform operations on the selected member through this page. The operation buttons are located at the top right of the page, as explained below:
- Run GC: Press this button to execute garbage collection on the selected member. A notification stating that the GC execution was successful will be shown.
- Thread Dump: Press this button to take a thread dump of the selected member and show it as a separate dialog to the user.
- Shutdown Node: Press this button to shutdown the selected member.
Scripting
You can use the scripting feature of this tool to execute codes on the cluster. To open this feature as a tab, select Scripting located at the toolbar on top. Once selected, the scripting feature opens as shown below.
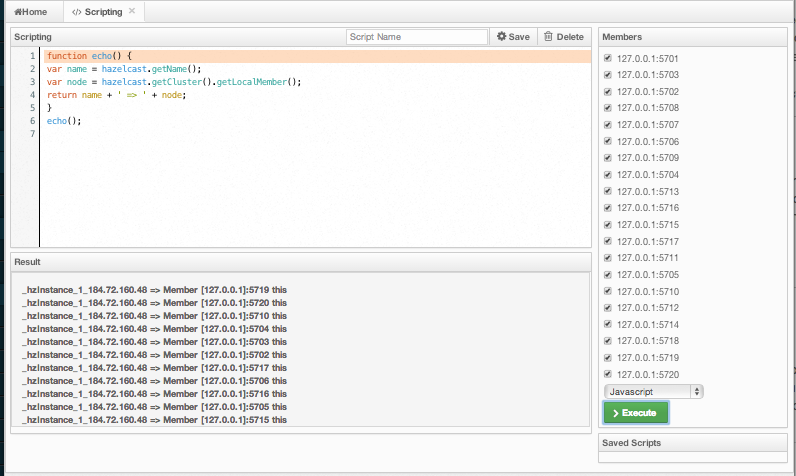
In this window, the Scripting part is the actual coding editor. You can select the members on which the code will execute from the Members list shown at the right side of the window. Below the members list, a combo box enables you to select a scripting language: currently, JavaScript, Ruby, Groovy and Python languages are supported. After you write your script and press the Execute button, you can see the execution result in the Result part of the window.
NOTE: To use the scripting languages other than JavaScript on a member, the libraries for those languages should be placed in the classpath of that member.
There are Save and Delete buttons on the top right of the scripting editor. To save your scripts, press the Save button after you type a name for your script into the field next to this button. The scripts you saved are listed in the Saved Scripts part of the window, located at the bottom right of the page. Click on a saved script from this list to execute or edit it. If you want to remove a script that you wrote and saved before, select it from this list and press the Delete button.
In the scripting engine you have a HazelcastInstance bonded to a variable named hazelcast. You can invoke any method that HazelcastInstance has via the hazelcast variable. You can see example usage for JavaScript below.
var name = hazelcast.getName();
var node = hazelcast.getCluster().getLocalMember();
var employees = hazelcast.getMap("employees");
employees.put("1","John Doe");
employees.get("1"); // will return "John Doe"
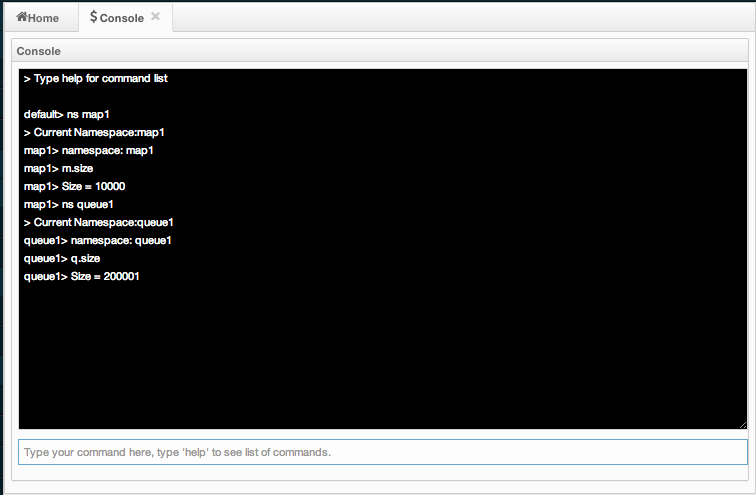
Executing Console Commands
The Management Center has a console feature that enables you to execute commands on the cluster. For example, you can perform puts and gets on a map, after you set the namespace with the command ns <name of your map>. The same is valid for queues, topics, etc. To execute your command, type it into the field below the console and press Enter. Type help to see all the commands that you can use.
Open a console window by clicking on the Console button located on the toolbar. Below is a sample view with some executed commands.
Creating Alerts
You can use the alerts feature of this tool to receive alerts and/or e-mail notifications by creating filters. In these filters, you can specify criteria for cluster members or data structures. When the specified criteria are met for a filter, the related alert is shown as a pop-up message on the top right of the page or sent as an e-mail.
Once you click the Alerts button located on the toolbar, the page shown below appears.
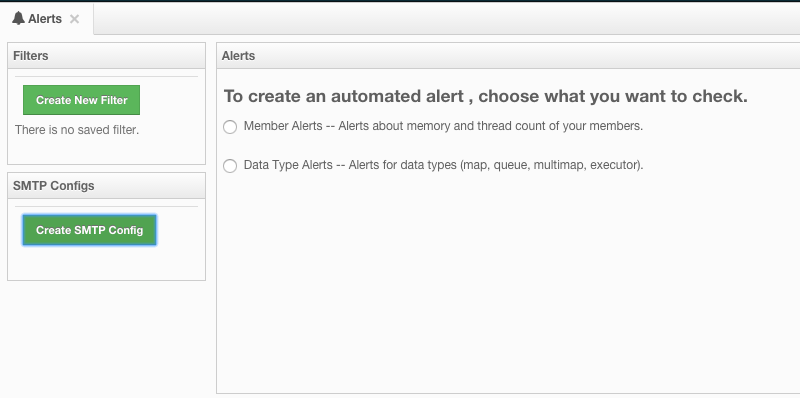
If you want to enable the Management Center to send e-mail notifications to the Management Center Admin users, you need to configure the SMTP server. To do this, click on the Create STMP Config shown above. The form shown below appears.
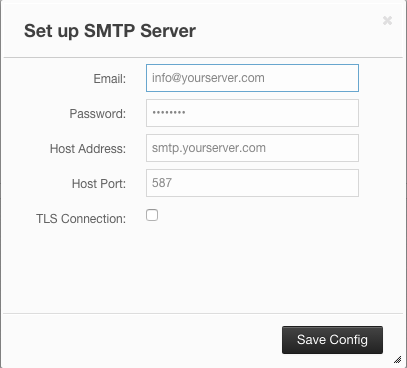
In this form, specify the e-mail address from which the notifications will be sent and also its password. Then, provide the SMTP server host address and port. Finally, check the TLS Connection checkbox if the connection is secured by TLS (Transport Layer Security).
After you provide the required information, click on the Save Config button. After a processing period (for a couple of seconds), the form will be closed if the configuration is created successfully. In this case, an e-mail will be sent to the e-mail address you provided in the form stating that the SMTP configuration is successful and e-mail alert system is created.
If not, you will see an error message at the bottom of this form as shown below.
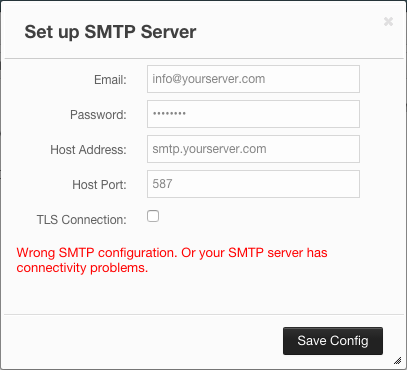
As you can see, the reasons can be wrong SMTP configuration or connectivity problems. In this case, please check the form fields and check for any causes for the connections issues with your server.
Creating Filters for Cluster Members
Select Member Alerts check box to create filters for some or all members in the cluster. Once selected, the next screen asks for which members the alert will be created. Select the desired members and click on the Next button. On the next page (shown below), specify the criteria.
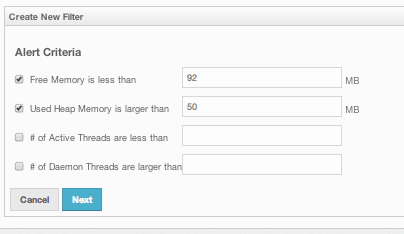
You can create alerts when:
- free memory on the selected member nodes is less than the specified number.
- used heap memory is larger than the specified number.
- the number of active threads are less than the specified count.
- the number of daemon threads are larger than the specified count.
When two or more criteria is specified they will be bound with the logical operator AND.
On the next page, give a name for the filter. Then, select whether notification e-mails will be sent to the Management Center Admins using the Send Email Alert checkbox. Then, provide a time interval (in seconds) for which the e-mails with the same notification content will be sent using the Email Interval (secs) field. Finally, select whether the alert data will be written to the disk (if checked, you can see the alert log at the folder /users/
Click on the Save button; your filter will be saved and put into the Filters part of the page. To edit the filter, click on the  icon. To delete it, click on the
  icon.
icon.
Creating Filters for Data Types
Select the Data Type Alerts check box to create filters for data structures. The next screen asks for which data structure (maps, queues, multimaps, executors) the alert will be created. Once a structure is selected, the next screen immediately loads and you then select the data structure instances (i.e. if you selected Maps, it will list all the maps defined in the cluster, you can select one map or more). Select as desired, click on the Next button, and select the members on which the selected data structure instances will run.
The next screen, as shown below, is the one where you specify the criteria for the selected data structure.
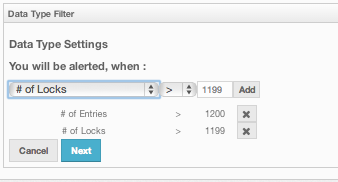
As the screen shown above shows, you will select an item from the left combo box, select the operator in the middle one, specify a value in the input field, and click on the Add button. You can create more than one criteria in this page; those will be bound by the logical operator AND.
After you specify the criteria, click the Next button. On the next page, give a name for the filter. Then, select whether notification e-mails will be sent to the Management Center Admins using the Send Email Alert checkbox. Then, provide a time interval (in seconds) for which the e-mails with the same notification content will be sent using the Email Interval (secs) field. Finally, select whether the alert data will be written to the disk (if checked, you can see the alert log at the folder /users/
Click on the Save button; your filter will be saved and put into the Filters part of the page. To edit the filter, click on the icon. To delete it, click on the icon.
Administering Management Center
NOTE: *This toolbar item is available only to admin users.
The Admin user can add, edit, and remove users and specify the permissions for the users of Management Center. To perform these operations, click on the Administration button located on the toolbar. The page below appears.
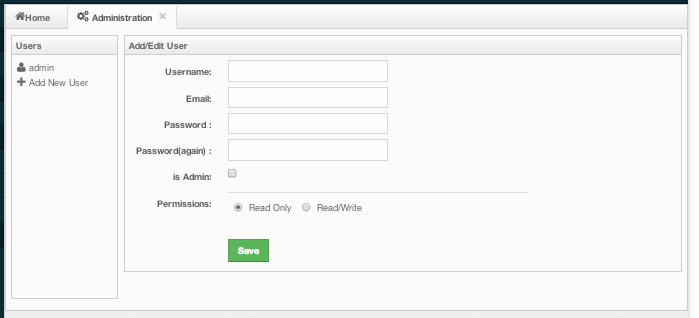
To add a user to the system, specify the username, e-mail and password in the Add/Edit User part of the page. If the user to be added will have administrator privileges, select isAdmin checkbox. Permissions checkboxes have two values:
- Read Only: If this permission is given to the user, only Home, Documentation and Time Travel items will be visible at the toolbar at that user's session. Also, users with this permission cannot update a map configuration, run a garbage collection and take a thread dump on a cluster member, or shutdown a member (please see Monitoring Members).
- Read/Write: If this permission is given to the user, Home, Scripting, Console, Documentation and Time Travel items will be visible. The users with this permission can update a map configuration and perform operations on the members.
After you enter/select all fields, click Save button to create the user. You will see the newly created user's username on the left side, in the Users part of the page.
To edit or delete a user, select a username listed in the Users. Selected user information appears on the right side of the page. To update the user information, change the fields as desired and click the Save button. To delete the user from the system, click the Delete button.
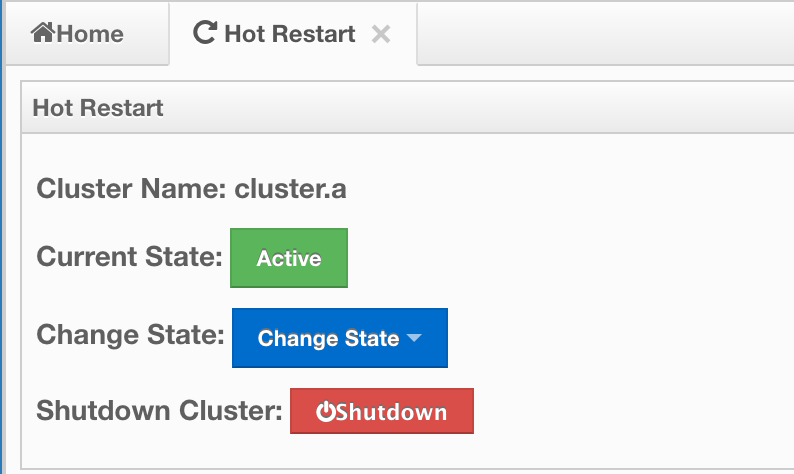
Hot Restart
NOTE: *This toolbar item is available only to admin users.
In this screen, the admin user can see the cluster state, change the cluster state or shutdown the cluster as seen below.
Cluster States
Active: Cluster will continue to operate without any restriction. All operations are allowed. This is the default state of a cluster.
Frozen: New members are not allowed to join, except the members left during this state or Passive state. All other operations except migrations are allowed and will operate without any restriction.
Passive: New members are not allowed to join, except the members left during this state or Frozen state. All operations, except the ones marked with
AllowedDuringPassiveState, will be rejected immediately.In Transition: Shows that the cluster state is in transition. This is a temporary and intermediate state. It is not allowed to set it explicitly.
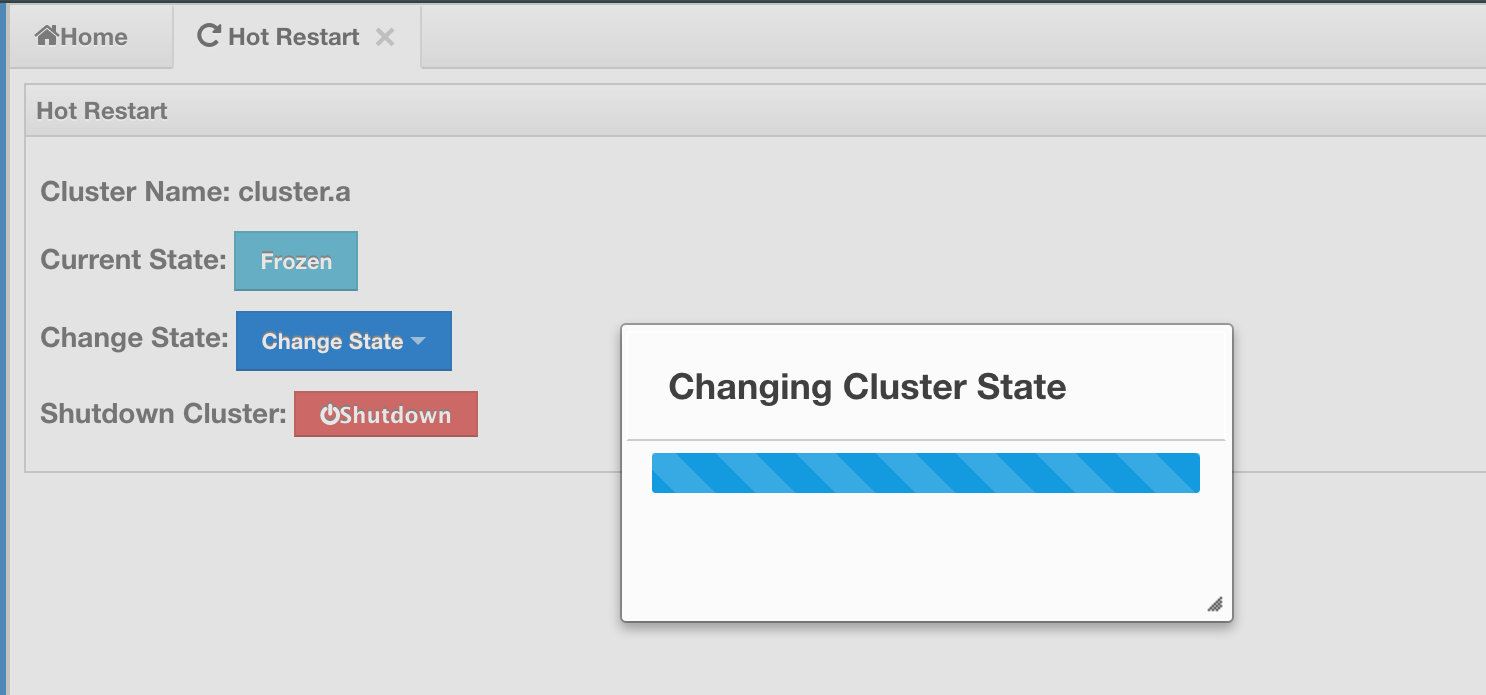
Changing Cluster State
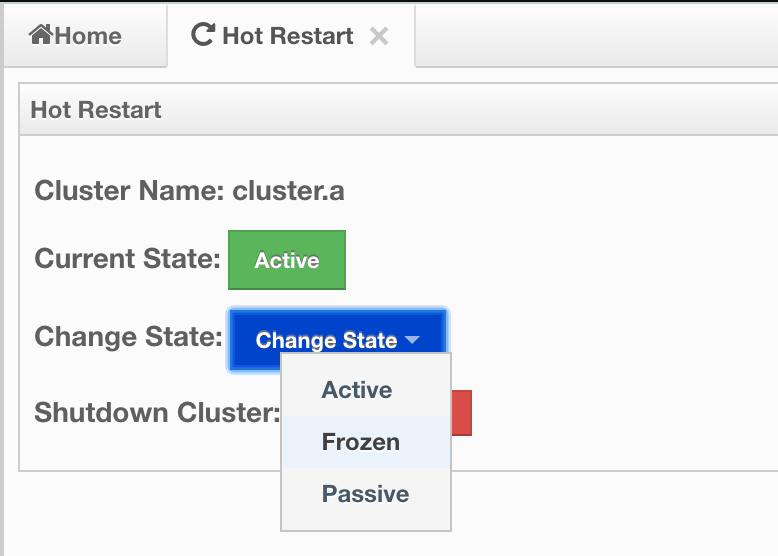
- Click the dropdown menu and choose the state you want your cluster change to. A pop-up will appear and stay on the screen until the state is successfully changed.
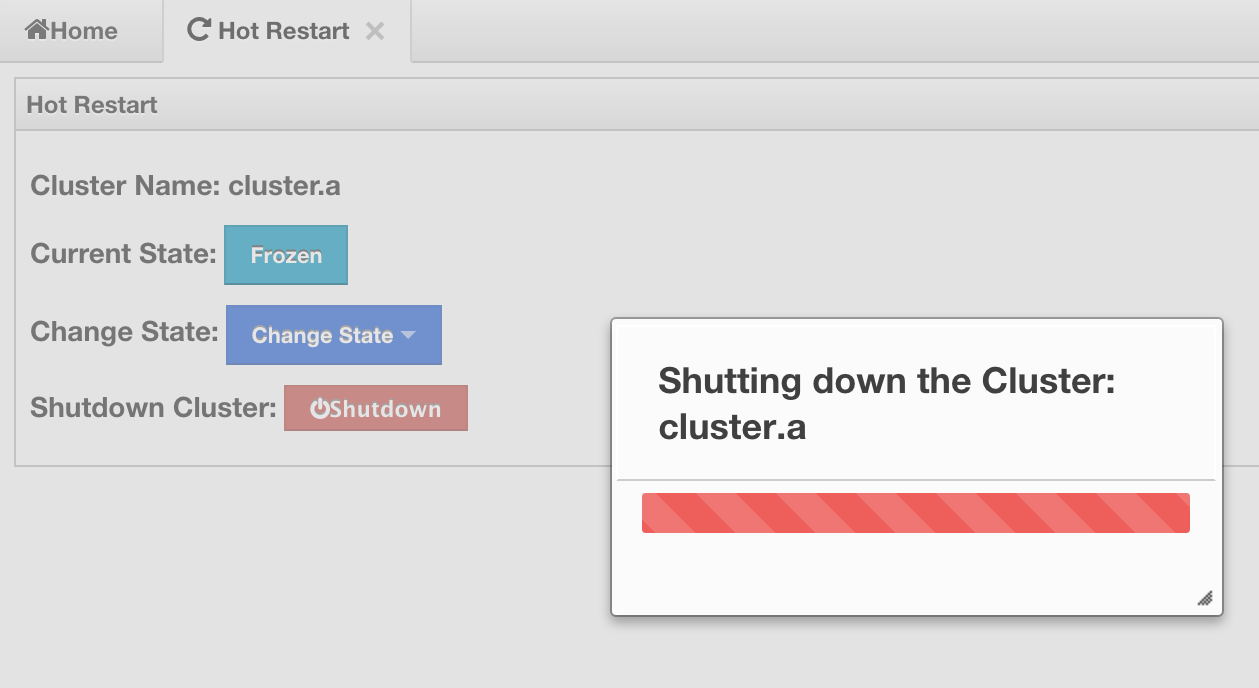
Shutting Down the Cluster
- Click the Shutdown button. A pop-up will appear and stay on screen until the cluster is successfully shutdown.
If an exception occurs during the state change or shutdown operation on the cluster, this exception message will be showed on the screen as a notification.
Checking Past Status with Time Travel
Use the Time Travel toolbar item to check the status of the cluster at a time in the past. When you select it on the toolbar, a small window appears on top of the page, as shown below.
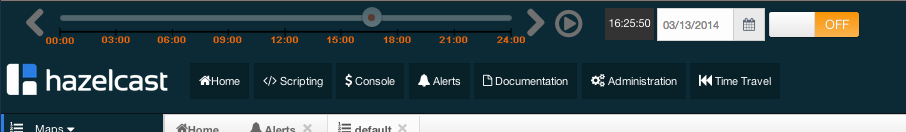
To see the cluster status in a past time, you should first enable the Time Travel. Click on the area where it says OFF (on the right of Time Travel window). It will turn to ON after it asks whether to enable the Time Travel with a dialog: click on Enable in the dialog to enable the Time Travel.
Once it is ON, the status of your cluster will be stored on your disk as long as your web server is alive.
You can go back in time using the slider and/or calendar and check your cluster's situation at the selected time. All data structures and members can be monitored as if you are using the management center normally (charts and data tables for each data structure and members). Using the arrow buttons placed at both sides of the slider, you can go back or further with steps of 5 seconds. It will show status if Time Travel has been ON at the selected time in past; otherwise, all the charts and tables will be shown as empty.
The historical data collected with Time Travel feature are stored in a file database on the disk. These files can be found in the folder <User's Home Directory>/mancenter<Hazelcast version>, e.g. /home/mancenter3.5. This folder can be changed using the hazelcast.mancenter.home property on the server where Management Center is running.
Time travel data files are created monthly. Their file name format is [group-name]-[year][month].db and
[group-name]-[year][month].lg. Time travel data is kept in the *.db files. The files with the extension lg are temporary files created internally and you do not have to worry about them.
Management Center has no automatic way of removing or archiving old time travel data files. They remain in the aforementioned folder until you delete or archive them.
Management Center Documentation
To see the documentation, click on the Documentation button located at the toolbar. Management Center manual will appear as a tab.
Suggested Heap Size
For 2 Nodes (Cluster Members)
| Mancenter Heap Size | # of Maps | # of Queues | # of Topics |
|---|---|---|---|
| 256m | 3k | 1k | 1k |
| 1024m | 10k | 1k | 1k |
For 10 Nodes
| Mancenter Heap Size | # of Maps | # of Queues | # of Topics |
|---|---|---|---|
| 256m | 50 | 30 | 30 |
| 1024m | 2k | 1k | 1k |
For 20 Nodes
| Mancenter Heap Size | # of Maps | # of Queues | # of Topics |
|---|---|---|---|
| 256m* | N/A | N/A | N/A |
| 1024m | 1k | 1k | 1k |
* With 256m heap, management center is unable to collect statistics.