Maps
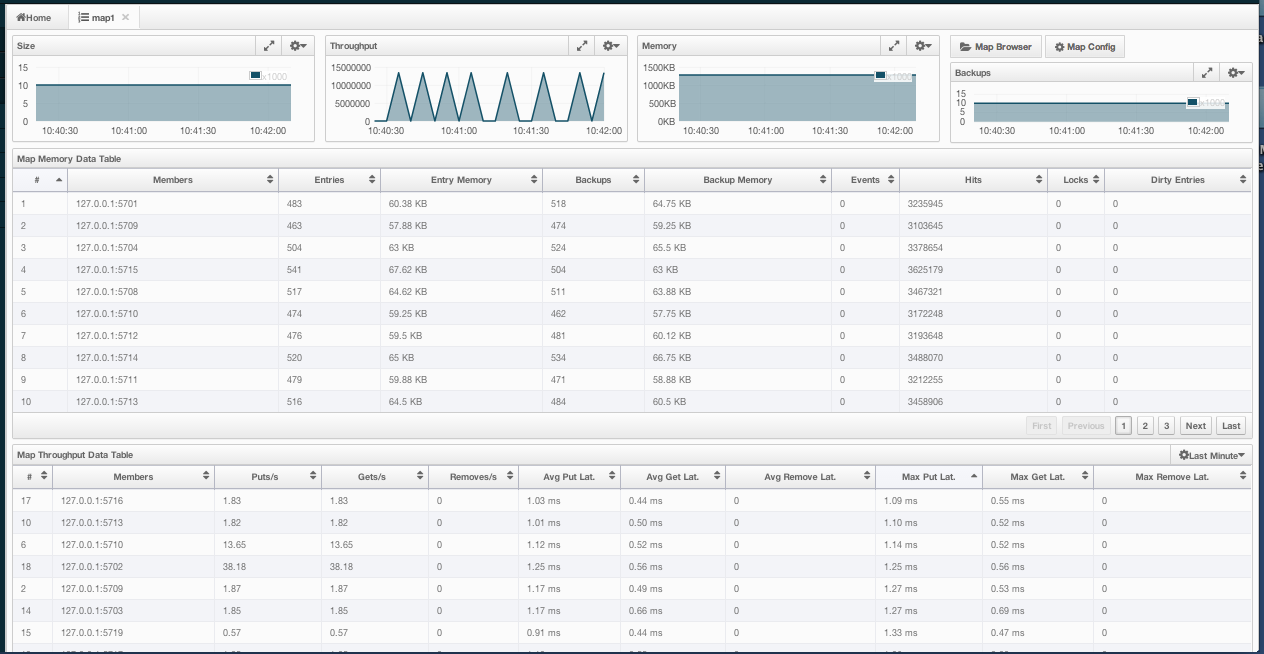
Map instances are listed under the Maps menu item on the left. When you click on a map, a new tab for monitoring that map instance is opened on the right, as shown below. In this tab, you can monitor metrics and also re-configure the selected map.

Below subsections explain the portions of this window.
Map Browser
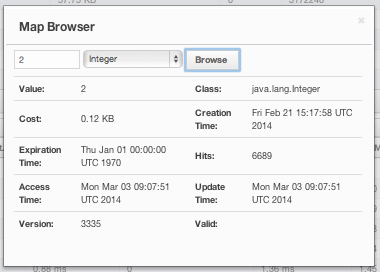
Map Browser is a tool used to retrieve properties of the entries stored in the selected map. It can be opened by clicking on the Map Browser button, located at top right of the window. Once opened, the tool appears as a dialog, as shown below.

Once the key and key's type is specified and Browse button is clicked, key's properties along with its value is listed.
Map Config
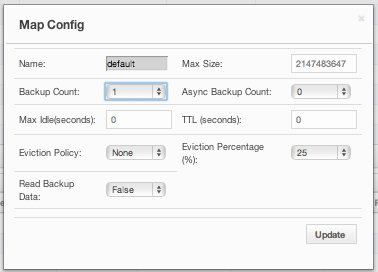
By using Map Config tool, you can set selected map's attributes like the backup count, TTL, and eviction policy. It can be opened by clicking on the Map Config button, located at top right of the window. Once opened, the tool appears as a dialog, as shown below.

Change any attribute as required and click Update button to save changes.
Map Monitoring
Besides Map Browser and Map Config tools, this page has many monitoring options explained below. All of these perform real-time monitoring.
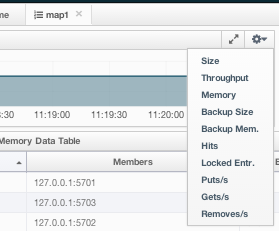
On top of the page, there are small charts to monitor the size, throughput, memory usage, backup size, etc. of the selected map in real-time. All charts' X-axis shows the current system time. Other small monitoring charts can be selected using ![]() button placed at top right of each chart. When it is clicked, the whole list of monitoring options are listed, as shown below.
button placed at top right of each chart. When it is clicked, the whole list of monitoring options are listed, as shown below.

When you click on a desired monitoring, the chart is loaded with the selected option. Also, a chart can be opened as a separate dialog by clicking on the  button placed at top right of each chart. Below monitoring charts are available:
- Size: Monitors the size of the map. Y-axis is the entry count (should be multiplied by 1000).
- Throughput: Monitors get, put and remove operations performed on the map. Y-axis is the operation count.
- Memory: Monitors the memory usage on the map. Y-axis is the memory count.
- Backups: It is the chart loaded when "Backup Size" is selected. Monitors the size of the backups in the map. Y-axis is the backup entry count (should be multiplied by 1000).
- Backup Memory: It is the chart loaded when "Backup Mem." is selected. Monitors the memory usage of the backups. Y-axis is the memory count.
- Hits: Monitors the hit count of the map.
- Puts/s, Gets/s, Removes/s: These three charts monitor the put, get and remove operations (per second) performed on the selected map.
Under these charts, there are Map Memory and Map Throughput data tables. Map Memory data table provides memory metrics distributed over nodes, as shown below.

From left to right, this table lists the IP address and port, entry counts, memory used by entries, backup entry counts, memory used by backup entries, events, hits, locks and dirty entries (in the cases where MapStore is enabled, these are the entries that are put to/removed from the map but not written to/removed from a database yet) of each node in the map. You can navigate through the pages using the buttons placed at the bottom right of the table (First, Previous, Next, Last). The order of the listings in each column can be ascended or descended by clicking on column headings.
Map Throughput data table provides information about the operations (get, put, remove) performed on each node in the map, as shown below.

From left to right, this table lists the IP address and port of each node, put, get and remove operations on each node, average put, get, remove latencies and maximum put, get, remove latencies on each node.
You can select the period in the combo box placed at top right corner of the window, for which the table data will be shown. Available values are Since Beginning, Last Minute, Last 10 Minutes and Last 1 Hour.
You can navigate through the pages using the buttons placed at the bottom right of the table (First, Previous, Next, Last). The order of the listings in each column can be ascended or descended by clicking on column headings.
