Members
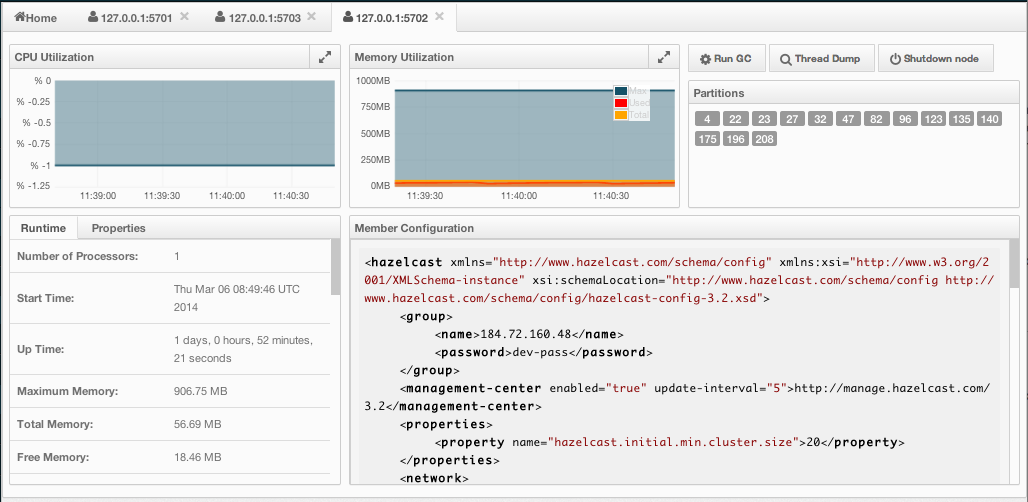
This menu item is used to monitor each cluster member (node) and also perform operations like running garbage colletion (GC) and taking a thread dump. Once a member is selected from the menu, a new tab for monitoring that member is opened on the right, as shown below.

CPU Utilization chart shows the CPU usage on the selected member in percentage. Memory Utilization chart shows the memory usage on the selected member with three different metrics (maximum, used and total memory). Both of these charts can be opened as separate windows using the ![]() button placed at top right of each chart, a more clearer view can be obtained by this way.
button placed at top right of each chart, a more clearer view can be obtained by this way.
The window titled with Partitions shows which partitions are assigned to the selected member. Runtime is a dynamically updated window tab showing the processor number, start and up times, maximum, total and free memory sizes of the selected member. Next to this, there is Properties tab showing the system properties. Member Configuration window shows the connected Hazelcast cluster's XML configuration.
Besides the aforementioned monitoring charts and windows, there are also operations you can perform on the selected memberthrough this page. You can see operation buttons located at top right of the page, explained below:
- Run GC: When pressed, garbage collection is executed on the selected member. A notification stating that the GC execution was successful will be shown.
- Thread Dump: When pressed, thread dump of the selected member is taken and shown as a separate dialog to th user.
- Shutdown Node: It is used to shutdown the selected member.
