Introduction
Hazelcast Management Center enables you to monitor and manage your nodes running Hazelcast. In addition to monitoring overall state of your clusters, you can also analyze and browse your data structures in detail, update map configurations and take thread dump from nodes. With its scripting and console module, you can run scripts (JavaScript, Groovy, etc.) and commands on your nodes.
Installation
Basically you will deploy mancenter-version.war application into your Java web server and then tell Hazelcast nodes to talk to that web application. That means, your Hazelcast nodes should know the URL of mancenter application before they start.
Here are the steps:
Download the latest Hazelcast ZIP from hazelcast.org.
ZIP contains
mancenter-version.warfile. Deploy it to your web server (Tomcat, Jetty, etc.). Let us say it is running athttp://localhost:8080/mancenter.Start your web server and make sure
http://localhost:8080/mancenteris up.Configure your Hazelcast nodes by adding the URL of your web app to your
hazelcast.xml. Hazelcast nodes will send their states to this URL.
<management-center enabled="true">http://localhost:8080/mancenter</management-center>
Start your Hazelcast cluster.
Browse to
http://localhost:8080/mancenterand login. Initial login username/password isadmin/admin
Management Center creates a directory with name "mancenter" under your "user/home" directory to save data files. You can change the data directory by setting hazelcast.mancenter.home system property.
Tool Overview
Once the page is loaded after selecting a cluster, tool's home page appears as shown below.
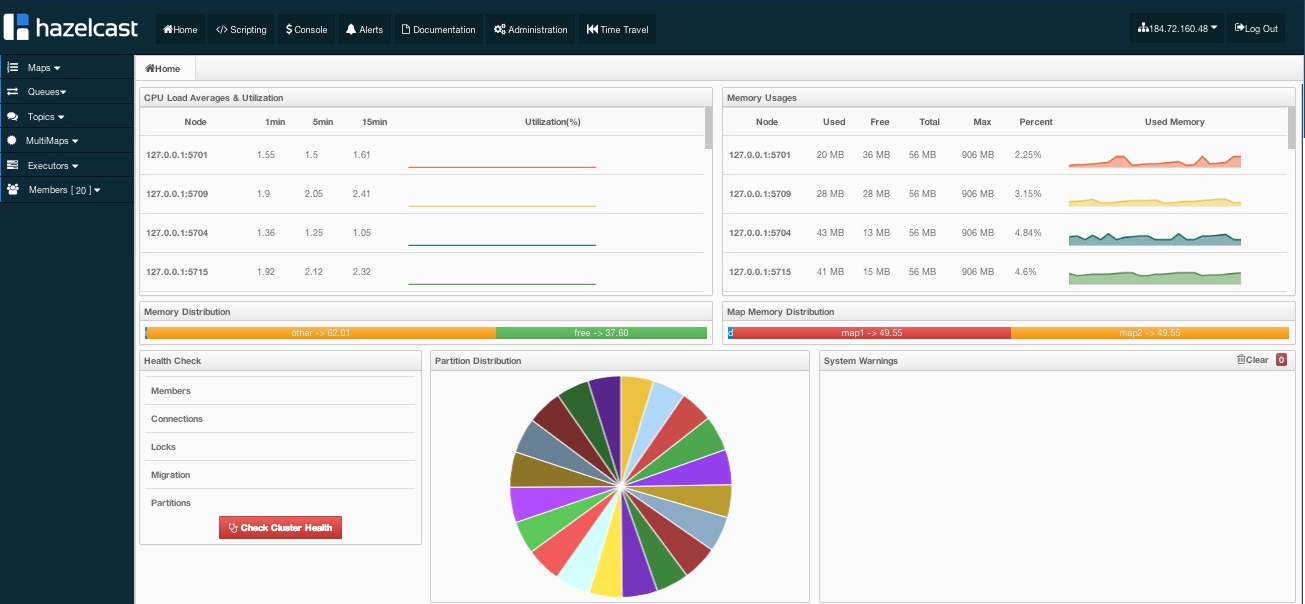
This page provides the fundamental properties of the selected cluster which are explained in Home Page section.
It also has a toolbar on the top and a menu on the left.
Toolbar
Toolbar has the following buttons:
- Home: When pressed, loads the home page shown above. Please see Home Page.
- Scripting: When pressed, loads the page used to write and execute user`s own scripts on the cluster. Please see Scripting.
- Console: When pressed, loads the page used to execute commands on the cluster. Please see Console.
- Alerts: It is used to create alerts by specifying filters. Please see Alerts.
- Documentation: It is used to open the documentation of Management Center in a window inside the tool. Please see Documentation.
- Administration: It is used by the admin users to manage users in the system. Please see Administration.
- Time Travel: It is used to see the cluster's situation at a time in the past. Please see Time Travel.
Cluster Selector: It is used to switch between clusters. When the mouse is moved onto this item, a dropdown list of clusters appears.
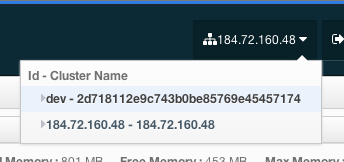
The user can select any cluster and once selected, the page immediately loads with the selected cluster's information.
- Logout: It is used to close the current user's session.
Note: Not all of the above listed toolbar items are visible to the users who are not admin or have read-only permission. Also, some of the operations explained in the later sections cannot be performed by users with read-only permission. Please see Administration for details.
Menu
Home page includes a menu on the left which lists the distributed data structures in the cluster and also all cluster members (nodes), as shown below.
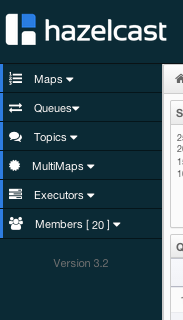
Menu items can be expanded/collapsed by clicking on them. Below is the list of menu items with the links to their explanations.
Tabbed View
Each time an item from the toolbar or menu is selected, it is added to main view as a tab, as shown below.

In the above example, Home, Scripting, Console, queue1 and map1 windows can be seen as tabs. Windows can be closed using the ![]() icon on each tab (except the Home Page; it cannot be closed).
icon on each tab (except the Home Page; it cannot be closed).
Home Page
This is the first page appearing after logging in. It gives an overview of the cluster connected. Below subsections describe each portion of the page.
CPU Utilization
This part of the page provides information related to load and utilization of CPUs for each node, as shown below.
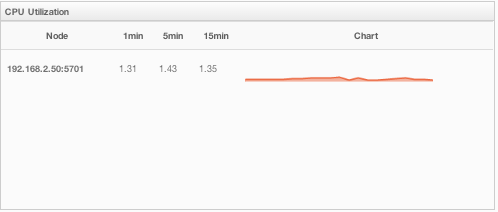
First column lists the nodes with their IPs and ports. Then, the loads on each CPU for the last 1, 5 and 15 minutes are listed. The last column (Chart) shows the utilization of CPUs graphically. When you move the mouse cursor on a desired graph, you can see the CPU utilization at the time to which cursor corresponds. Graphs under this column shows the CPU utilizations approximately for the last 2 minutes.
Memory Utilization
This part of the page provides information related to memory usages for each node, as shown below.
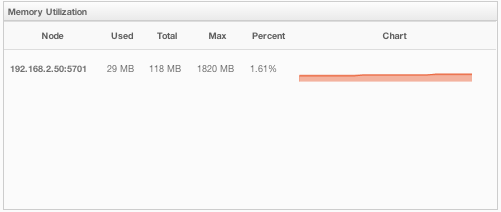
First column lists the nodes with their IPs and ports. Then, used and free memories out of the total memory reserved for Hazelcast usage are shown, in real-time. Max column lists the maximum memory capacity of each node and Percent column lists the percentage value of used memory out of the maximum memory. The last column (Chart) shows the memory usage of nodes graphically. When you move the mouse cursor on a desired graph, you can see the memory usage at the time to which cursor corresponds. Graphs under this column shows the memory usages approximately for the last 2 minutes.
Memory Distribution
This part of the page graphically provides the cluster wise breakdown of memory, as shown below. Blue area is the memory used by maps, dark yellow area is the memory used by non-Hazelcast entities and green area is the free memory (out of whole cluster`s memory capacity).

In the above example, you can see 0.32% of the total memory is used by Hazelcast maps (it can be seen by moving the mouse cursor on it), 58.75% is used by non-Hazelcast entities and 40.85% of the total memory is free.
Map Memory Distribution
This part is actually the breakdown of the blue area shown in Memory Distribution graph explained above. It provides the percentage values of the memories used by each map, out of the total cluster memory reserved for all Hazelcast maps.

In the above example, you can see 49.55% of the total map memory is used by map1 and 49.55% is used by map2.
Health Check
This part is useful to check how the cluster in general behaves. It lists the nodes (cluster members), locks and partition mismatches along with the information related to migrations and node interconnections. To see these, just click on Check Cluster Health button. A sample is shown below.
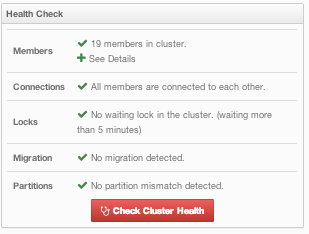
You can see each node's IP address and port by clicking on the plus sign at the Members.
Partition Distribution
This pie chart shows what percentage of partitions each node has, as shown below.
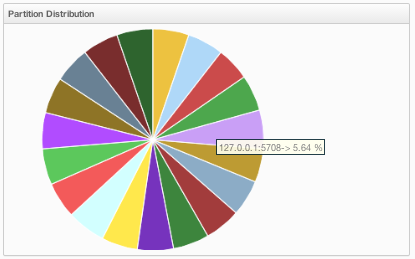
You can see each node's partition percentages by moving the mouse cursor on the chart. In the above example, you can see the node "127.0.0.1:5708" has 5.64% of the total partition count (which is 271 by default and configurable, please see Advanced Configuration Properties).
System Warnings
This part of the page shows informative warnings in situations like shutting down a node, as shown below.
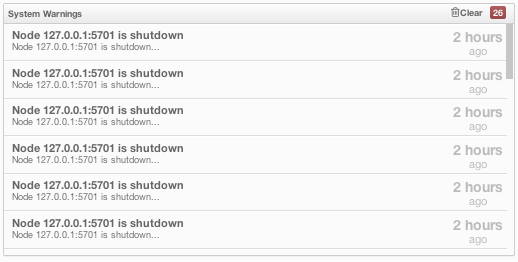
Warnings can be cleared by clicking on the Clear link placed at top right of the window.
